Disclaimer: Views in this blog do not promote, and are not directly connected to any L&G product or service. Views are from a range of L&G investment professionals, may be specific to an author’s particular investment region or desk, and do not necessarily reflect the views of L&G. For investment professionals only.
No man is an island
This month, we assess the impact of global factors on gilts.
Ahead of the Makerfield by-election, there is a lot more focus than usual on the ebbs and flows in the UK government bond market. We think that context is important. Our charts of the month look at the changes in gilt yields over the last few years against the backdrop of what’s been happening in global markets.
The UK is a small, open economy. When measured by GDP, it makes up just 2-3% of the global economy*. So, we believe it is therefore reasonable to assume that UK political and economic conditions are likely to have little impact on markets overseas. However, in the opposite direction, global factors have a big bearing on what happens in the UK bond markets.
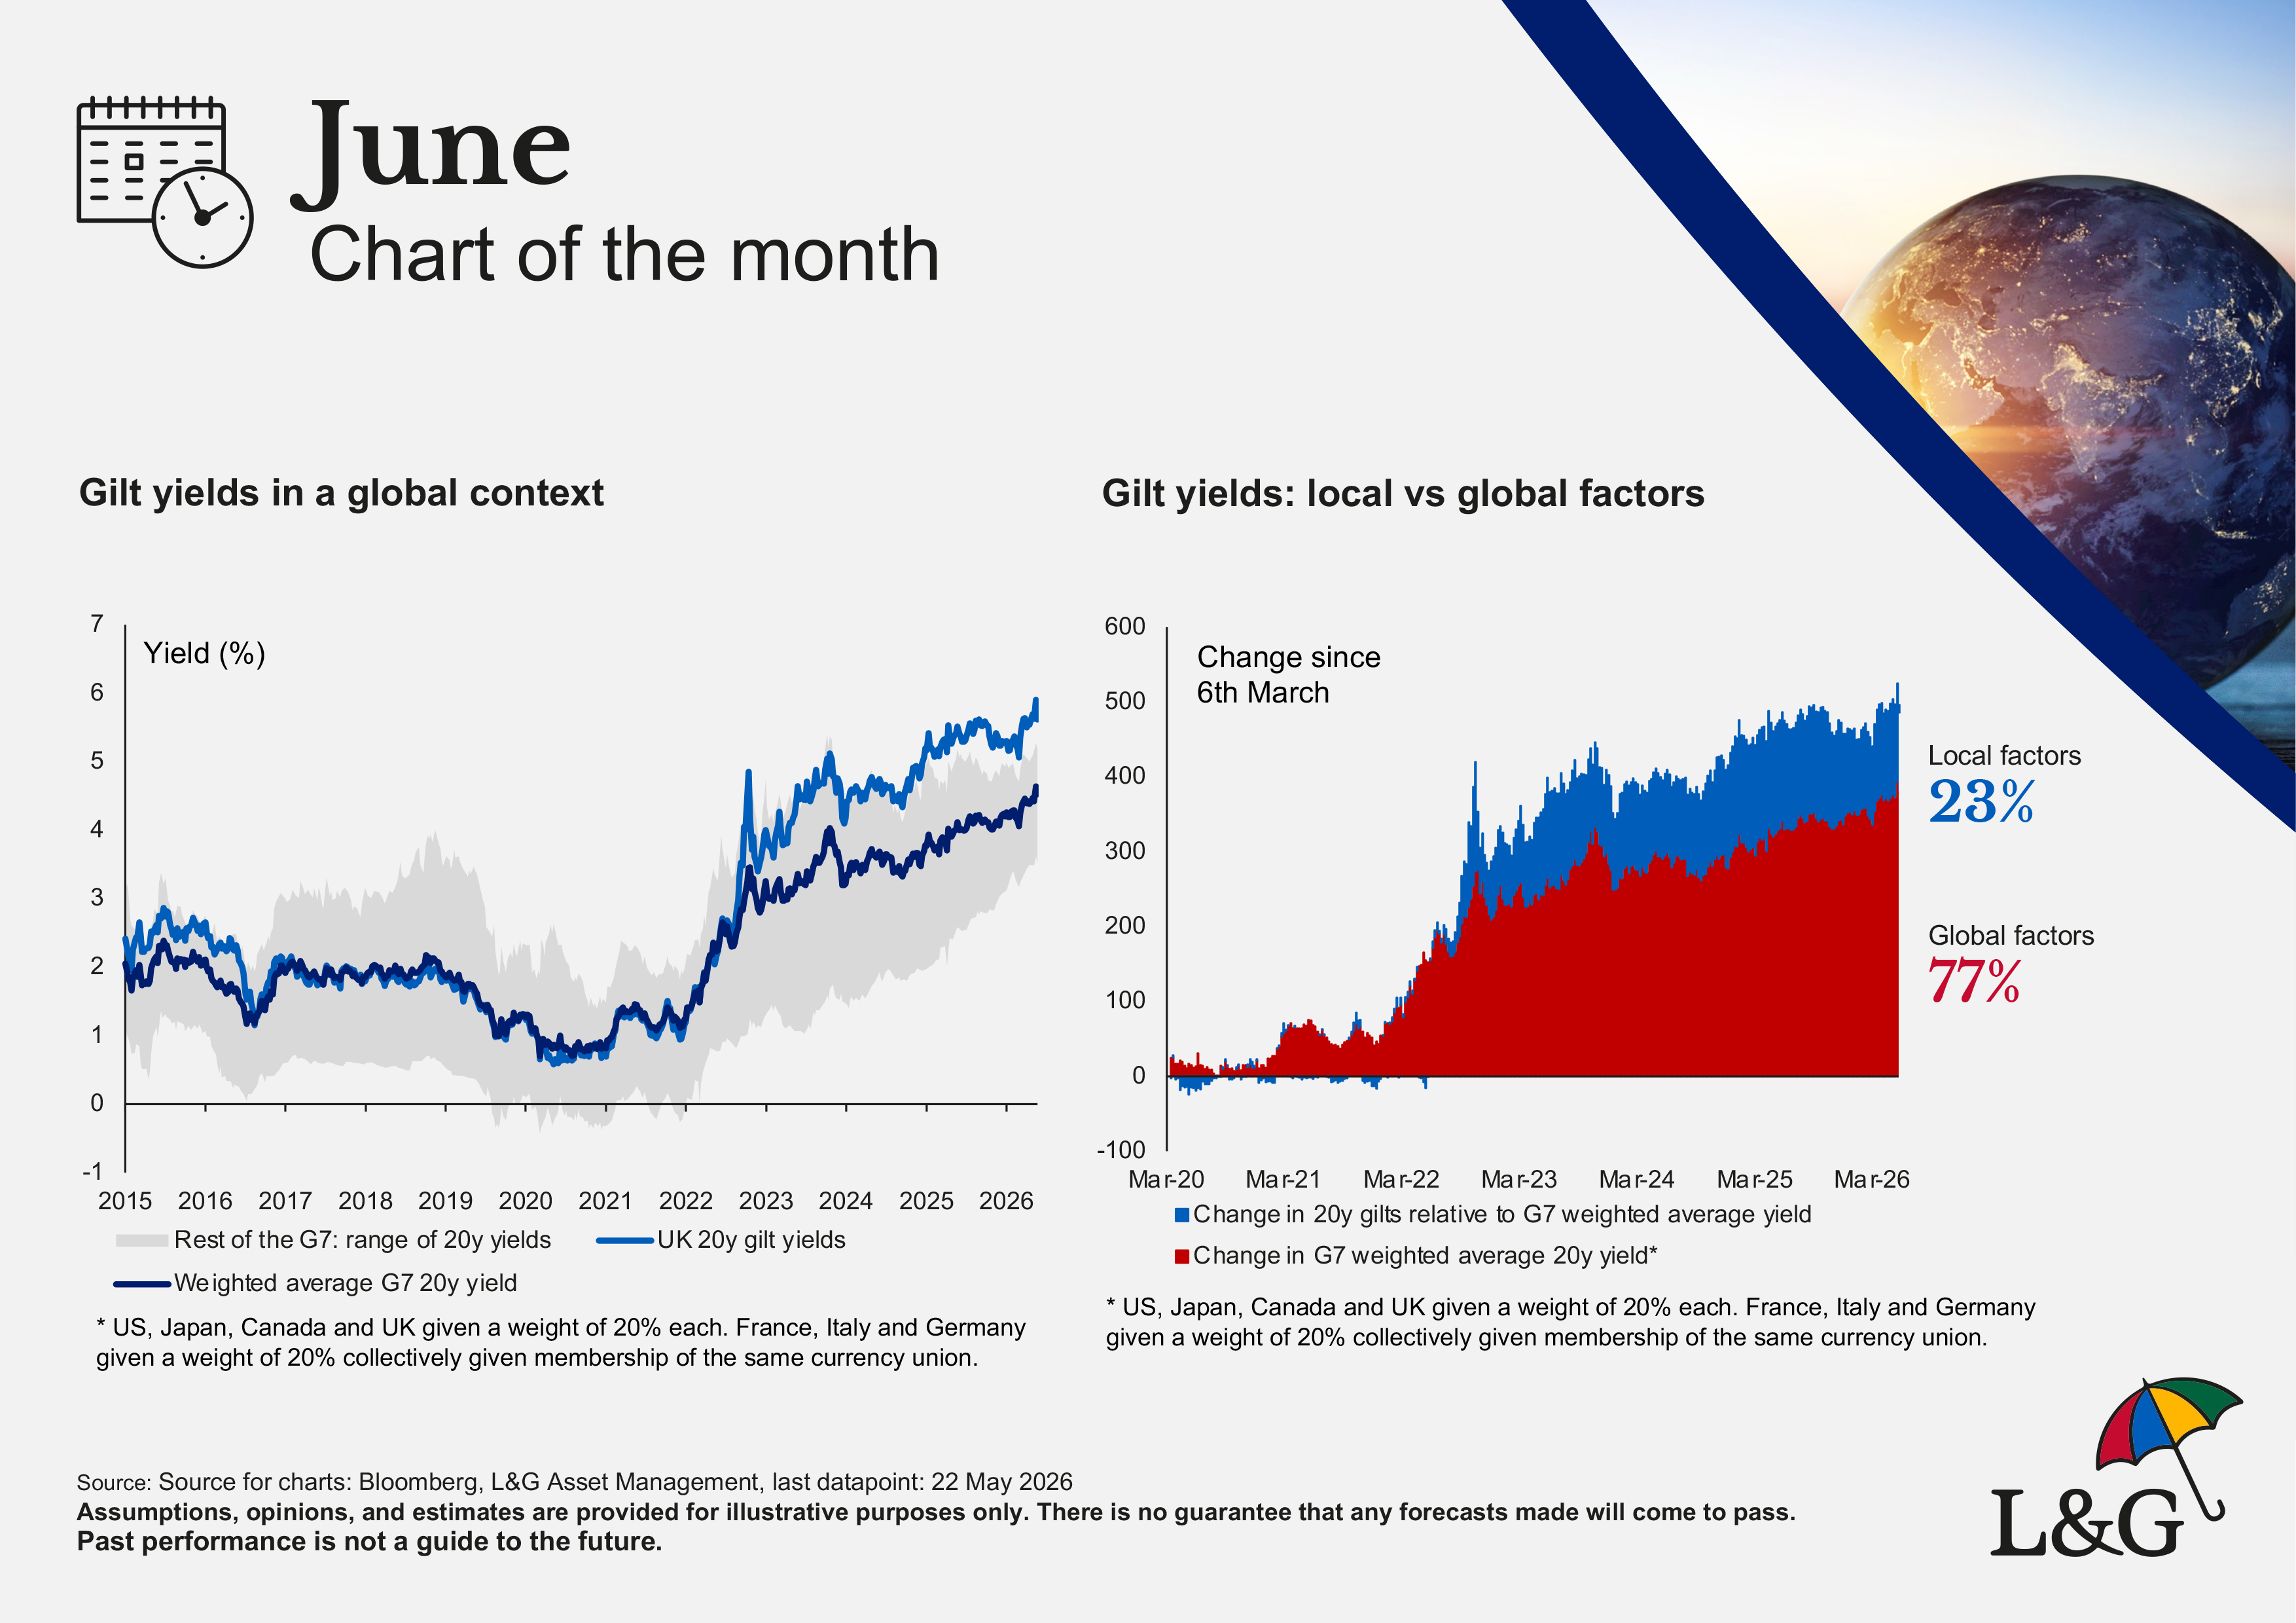
There are a couple of different ways of looking at this. Our first chart compares the yield on 20-year UK government bonds (in green) with the range of yields available in other G7 markets (the grey band) and the weighted average of the G7 as a proxy for a global benchmark yield (in blue). UK yields moved in lockstep with that average from late 2016 through to mid-2022. They have since diverged with a combination of inflation and fiscal concerns playing a role in driving gilt yields above the global baseline.
The idiosyncratic element appears to be worth just over 100bp on yields. In the ready reckoners provided by the OBR**, that eventually equates to around £10bn of additional government expenditure per annum.
But we shouldn’t overstate the extent to which gilt yields are ‘made in Britain.’ The second chart looks at the increase in yields since the low point in March 2020. Just over ¾ of the rise is global with the post-COVID jump in inflation and increase in policy rates everywhere being the biggest story. Less than ¼ is unique to the UK.
In the words of John Donne in the 17th century, “no man is an island, entire of himself; every man is a piece of the continent, a part of the main”. The same is true of the gilt market.
* Source: IMF DataMapper
** Source: Office of Budget Responsibility, March 2026 Economic and Fiscal Outlook
***Source for charts: Bloomberg, L&G Asset Management, last datapoint: 22/05/26

Recommended content for you
Learn more about our business
We are one of the world's largest asset managers, with capabilities across asset classes to meet our clients' objectives and a longstanding commitment to responsible investing.
