Disclaimer: Views in this blog do not promote, and are not directly connected to any L&G product or service. Views are from a range of L&G investment professionals, may be specific to an author’s particular investment region or desk, and do not necessarily reflect the views of L&G. For investment professionals only.
Chart of the month: A multi-trillion-dollar question
The last month for semiconductor stocks has been extraordinary. In May’s chart of the month, our Co-Head of Asset Allocation and Head of Macro unpicks a behemoth’s surge.

While investors have been distracted by tensions in the Middle East, something unprecedented has been happening in semiconductor stocks. This is not an obscure corner of the equity market, but a USD12trillion behemoth, which has been on a record-breaking rally.
The Philadelphia Semiconductor Index is a modified market capitalization weighted index of the 30 largest US semi-conductor names that was launched on 1 December 1993. Since then, it has rallied a staggering 10,000% at a compound annualized growth rate of 15% per annum.
Recent months have broken records. As the enabling technology of the artificial intelligence boom, semiconductors have been compared to the ‘picks and shovels’ of the Gold Rush era. Over the last year, returns have largely been powered by earnings growth. At the index level, earnings are expected to grow over 80% in 2026 and a further 30% in 2027. The standard index multiple (price divided by 12-month forward earnings) is almost entirely unchanged at just over 24 since the start of the year.
But the last month has been extraordinary as shown in the chart below.
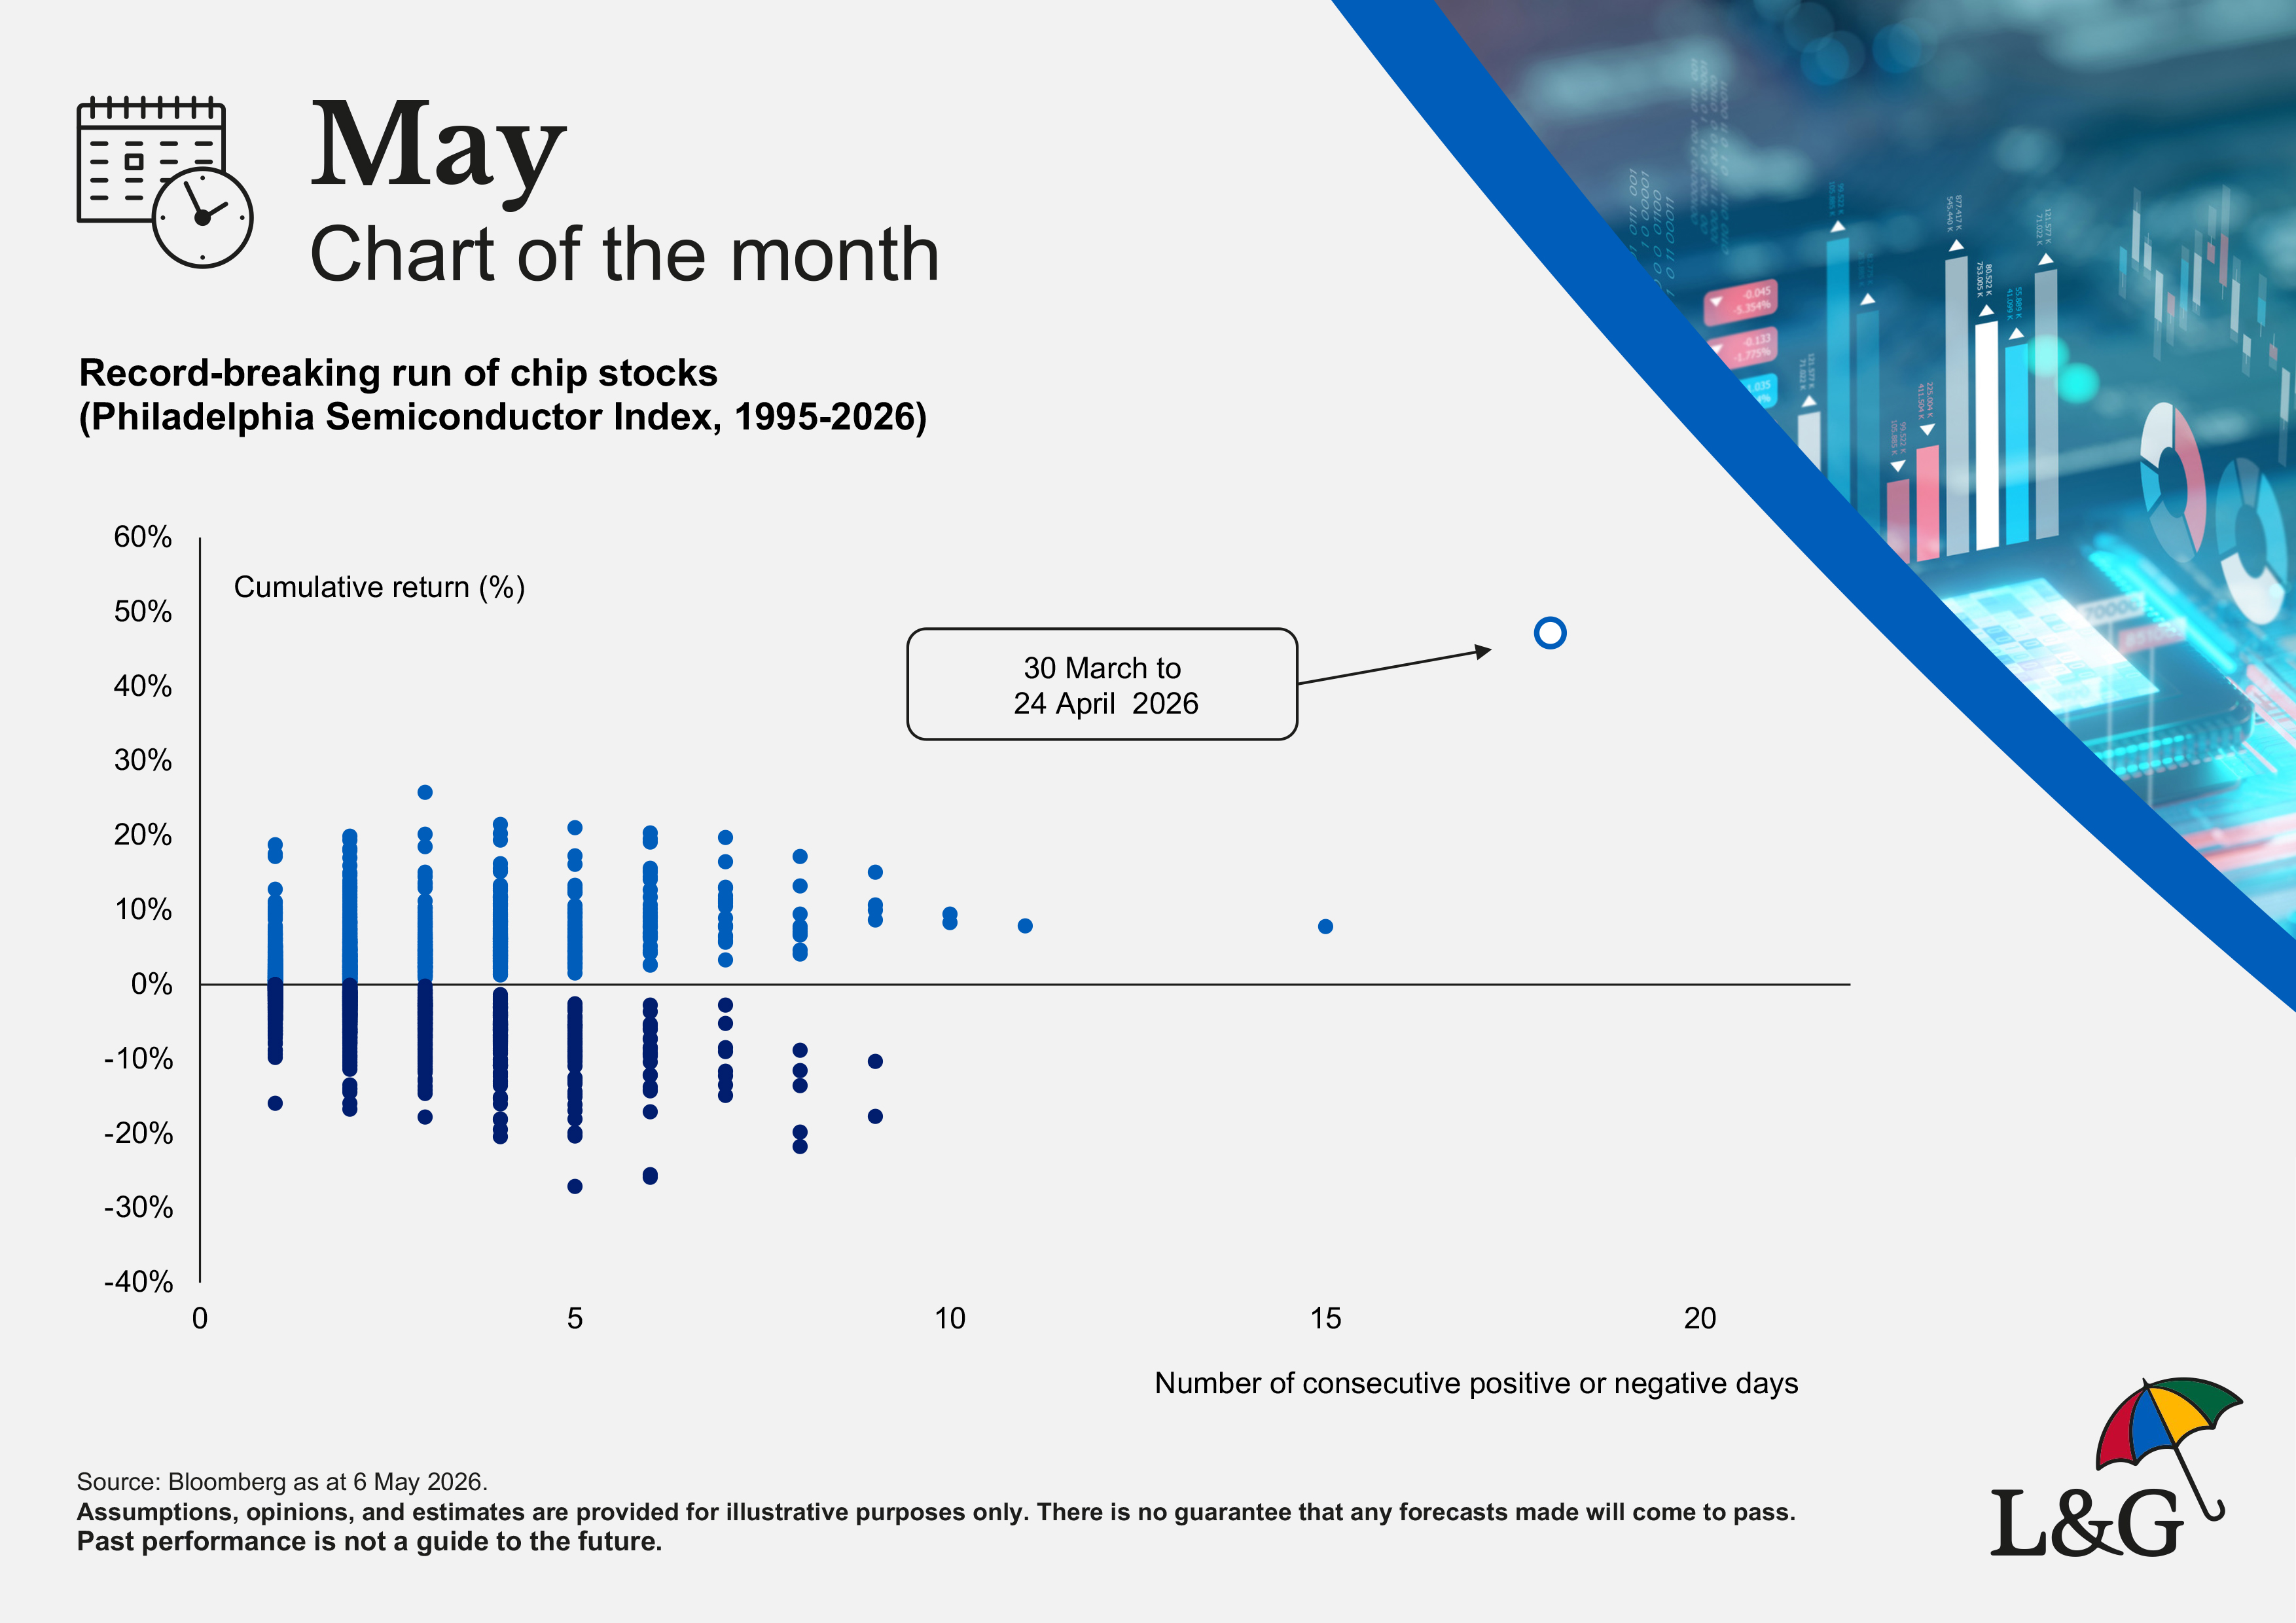
Each dot on the chart is a continuous run of positive (in light blue) or negative (in dark blue) performance. Before last month, the index had only been up more than ten days in a row twice (June 2014 and October 2017) delivering an 8% return on both occasions.
Starting on 30 March this year, the index was up for 18 trading days in a row. That blew through the records for the longest sustained rally in the index’s history. Even more striking is the 47% rally that occurred during such a brief period. Saying that is unusual would be a serious understatement.
This is the point at which I feel obliged to highlight that “the past is no guide to future performance”. Investors obviously want to know whether this performance is sustainable. Everything hinges on the price of semiconductor chips themselves where AI-demand has swamped the industry’s capacity to necessary supply the memory and compute.
We know that industry-wide margins above 40% are likely to attract investment in additional capacity. In turn, that additional capacity will help bring the market back into balance. Working out how long that equilibrating process will take is the USD12 trillion question.

Recommended content for you
Learn more about our business
We are one of the world's largest asset managers, with capabilities across asset classes to meet our clients' objectives and a longstanding commitment to responsible investing.
