Disclaimer: Views in this blog do not promote, and are not directly connected to any L&G product or service. Views are from a range of L&G investment professionals, may be specific to an author’s particular investment region or desk, and do not necessarily reflect the views of L&G. For investment professionals only.
A tale of two markets
What should investors make of an environment in which long-term government bond yields are at their highest in a generation, yet stocks keep climbing?

Something unusual is happening in financial markets. Long-term government bond yields are at their highest in a generation, yet stocks keep climbing. These trends cannot coexist indefinitely. Eventually, one will have to give.
We explore what is driving this disconnect, and where it leaves investors.
The bond market is quietly crashing
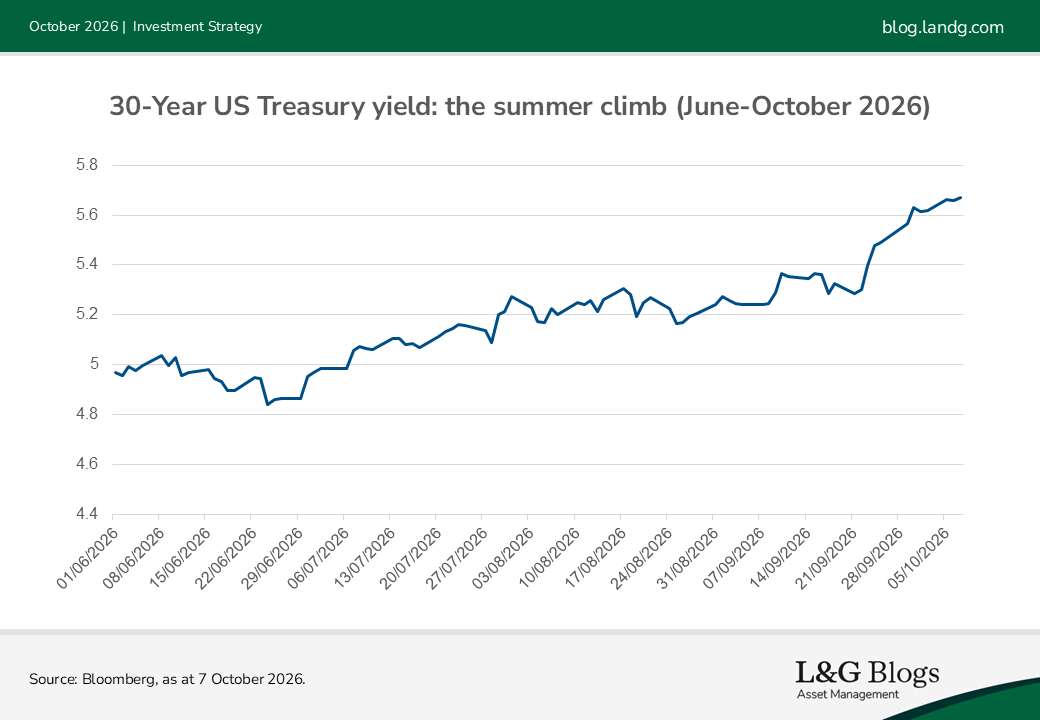
Bonds have generated losses while equities have remained strong, weakening balanced-portfolio returns. The 30-year US Treasury yield reached 5.63% in early October, its highest in 24 years.[1] Because bond prices move inversely to yields, an investor who bought at the end of June, when the yield was 4.96%, is now sitting on a loss of roughly 10%.[1]
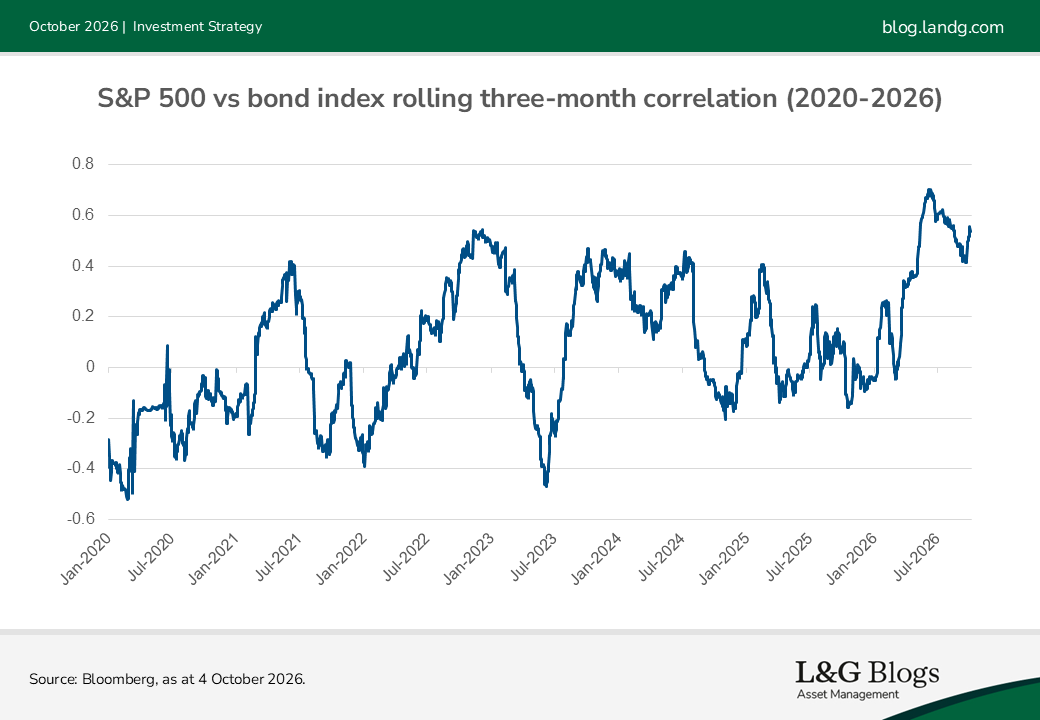
For much of the past two decades, bonds cushioned balanced portfolios when stocks fell. That relationship is weakening: the three-month rolling correlation between the S&P 500 and the Bloomberg US Aggregate Bond Index peaked at 0.70 in June, meaning the two were moving together rather than offsetting each other.[2]
Equity strength is also narrow. As of 6 October, only 29% of S&P 500 stocks were above their 50-day moving average.[3] Since June, technology has gained roughly 4%, while utilities and real estate have fallen by a similar amount [4], suggesting that AI-linked stocks are masking weakness elsewhere. The next significant sell-off could test whether bonds still provide protection.
The forces pushing yields higher
Various factors are contributing to higher government bond yields, including:
- Inflation: PCE inflation, the Federal Reserve’s preferred measure, is running at 3.4%, with core inflation at 3%,[5] partly as a result of high oil prices due to tensions in the Middle East.
- Debt: US federal debt has passed $40trn.[6] The volume of supply is putting upward pressure on yields.
- France: France’s 10-year bond yield rose 65 basis points (bps) in September, widening the gap between French and German borrowing costs to over 100bps.[7] European sovereign stress can ripple through global markets.
- Japan: As the largest foreign holder of US government bonds, Japan could put further pressure on yields if it sold Treasuries to support the yen.[8] Intervention, Federal Reserve dollar funding and purchases of longer-dated bonds provided temporary relief.[8] Yet after the Bank of Japan raised rates to 1.25%, the yen weakened and Treasury yields rose again.
AI is borrowing heavily
The technology giants driving the AI boom can still access debt, but the cost is rising. Wall Street expects around $300bn of AI-related investment-grade bond issuance this year.[9]
This borrowing competes with government debt for the same capital. AI-related issuance is estimated to have added around 15bps to long-dated US yields, compounding pressure from government deficits and sovereign supply.[10] Higher yields raise financing costs across the economy, slowing spending and, eventually, company earnings.
For now, however, equities keep rising. The S&P 500 hit a record high on 6 October, and the market sees the index posting around 17% forward EPS growth, roughly four times the historical average. With the 10-year Treasury yield at 5.27%, broadly matching the index’s forward earnings yield, the equity risk premium has effectively disappeared.
The same AI investment expected to deliver exceptional growth is therefore helping to raise the discount rate applied to that growth.
A flood of new shares
The stock market is absorbing far more new equity. After a decade in which US companies bought back more shares than they issued, supply is rising again.[11] Global equity issuance is running around 79% ahead of the same period last year,, led by the US.[12]
The US investment firm GMO* estimates that supply is shifting from shrinking by roughly 1% a year to growing by close to 5%, potentially leaving returns around 20% below average over the next 12-18 months.[11]
This extra supply may be harder to absorb because passive funds now hold more than half of equity assets and buy according to benchmark weights, while active funds have also become more benchmark-aware.[11] With fewer flexible buyers and long-term Treasuries yielding more than 5%,[1] new listings must compete harder for capital. But what happens if growth falters?
Recession scenarios
Markets are not pricing in a recession, and the data supports that view.[13] However, if growth weakens, persistent inflation could limit the Fed’s ability to cut rates, leaving investors exposed to falling earnings and less protection from bonds.
A soft landing, in which growth slows but profits stay positive, remains possible. However, in a mild recession above-target inflation could slow rate cuts as earnings fall. In a severe downturn, stocks and bonds could decline together, as they did in 2022.
The difference now is that the forces pushing yields higher are structural rather than temporary.
Where next for investors?
Against this backdrop, investors may focus on assets that can benefit from higher yields and the long-term build-out of AI infrastructure.
We believe short-dated Treasuries, with two-year yields around 4.8%, offer income with relatively little duration risk.[1] Inflation-linked bonds may also appeal: the 10-year TIPS real yield of 2.9% is above the CBO’s longer-run US growth estimate of 1.8%.[1,14]
Meanwhile, power infrastructure and electricity grids could benefit from AI-driven demand, especially if they can fund investment from their own cash flows.
However, the uncomfortable truth is that when bonds held to cushion adverse moves are themselves part of the problem, investors may need to look beyond conventional equity-bond diversification. Combining lower-duration exposure, inflation protection and assets supported by structural demand could help portfolios navigate this more challenging environment.
*For illustrative purposes only. Reference to a particular security is on a historic basis and does not mean that the security is currently held or will be held within an L&G portfolio. The above information does not constitute a recommendation to buy or sell any security.
It should be noted that diversification is no guarantee against a loss in a declining market.
Sources
[1] Bloomberg Terminal, 4 October 2026. 30-year Treasury (USGG30YR Index): peak 5.632% on 30 September 2026; 30 June close 4.955%; implied price loss of approximately 10% from 30 June to 30 September. 10-year Treasury (USGG10YR Index): 5.275%. Two-year Treasury (USGG2YR Index): 4.829%. 10-year TIPS real yield (USGGT10Y Index): 2.913%.
[2] Bloomberg Terminal, 4 October 2026. Rolling three-month correlation between the S&P 500 (SPX Index) and Bloomberg US Aggregate Bond Index (LBUSTRUU Index), calculated from daily total returns. Peak of 0.709 reached on 6 June 2026. Five-year monthly correlation: 0.60.
[3] Bloomberg Terminal, 6 October 2026. Percentage of S&P 500 constituents trading above their 50-day moving average, calculated from constituent-level price data. Reading: 29.4%.
[4] Bloomberg Terminal, 7 October 2026. S&P 500 sector index total returns from 1 June 2026 to 7 October 2026. S&P 500 Information Technology Index (S5INFT): +4.4%; S&P 500 Real Estate Index (S5RLST): −2.6%; S&P 500 Utilities Index (S5UTIL): −3.1%.
[5] US Bureau of Economic Analysis, PCE Price Index, August 2026 release, published 30 September 2026. Headline PCE year-on-year: 3.4%; core PCE year-on-year: 3.0%.
[6] US Treasury Fiscal Data. Total public debt outstanding as of 31 August 2026: $40.18 trillion. This figure includes both debt held by the public and intragovernmental holdings.
[7] Bloomberg Terminal, 4 October 2026. France 10-year OAT yield (GFRN10 Index): 1 September open 4.207%; 30 September close 4.857%, an increase of 65bps. The OAT-Bund spread crossed 100bps during September 2026.
[8] US Treasury Department and Bank of Japan, joint currency-market intervention, September 2026. First coordinated US-Japan yen purchase since 2011. Federal Reserve FIMA repo facility used by Japan as an alternative to outright Treasury sales. US Treasury buybacks of longer-dated bonds briefly reduced the 30-year yield by approximately 10bps.
[9] Bloomberg News, May 2026. AI-related investment-grade bond issuance 2026 full-year estimate: approximately $300 billion.
[10] UBS Strategy Research, September 2026. Corporate issuance from mega-cap technology companies estimated to have added approximately 15bps to long-dated US yields.
[11] GMO Quarterly Letter, 3Q 2026. Ben Inker and John Pease, “A Catalyst for the AI Bubble Break.” A 1% increase in supply is associated with an approximately 4% decline in market value over 12 months. Equity supply is shifting from approximately −1% to approximately +5% per annum, implying a potential return headwind of approximately 20% over 12-18 months. Passive funds represent more than 50% of equity assets. Approximately 30 cents per dollar is invested opportunistically today, compared with roughly 75 cents in the 1980s. Among active US equity mutual funds specifically, almost 80 cents per dollar went into off-benchmark positions in the 1980s, compared with 60 cents in 2025.
[12] Bloomberg News, August 2026. Global equity offerings running approximately 79% ahead year-on-year through August 2026, with US supply the primary driver.
[13] Bloomberg as of 6 October 2026: one-year US recession probability 20% (ECRPUS 1Y Index); 2s10s spread +48bps; US HY OAS 298bps (LF98STAT Index).
[14] Congressional Budget Office, The Budget and Economic Outlook: 2026 to 2036, February 2026. Longer-run real GDP growth estimate: approximately 1.8%.

Recommended content for you
Learn more about our business
We are one of the world's largest asset managers, with capabilities across asset classes to meet our clients' objectives and a longstanding commitment to responsible investing.