
Disclaimer: Views in this blog do not promote, and are not directly connected to any L&G product or service. Views are from a range of L&G investment professionals, may be specific to an author’s particular investment region or desk, and do not necessarily reflect the views of L&G. For investment professionals only.
Should portfolios chase correlation spikes?
Correlations rise in stressed markets. But should a portfolio-tilting model chase those moves? We explain why doing so may add more sensitivity than insight.

At L&G, we recently developed what we call our MATRIX framework[1] – a quantitative approach that can be used to support dynamic tilting of multi-asset portfolios. MATRIX combines inputs including valuations and risk signals to produce a set of tilts to apply to a given strategic asset allocation (SAA). As with any framework of this kind, it must take a view on how those inputs evolve through time.
Correlation spikes in stressed markets are a familiar feature of financial markets. When they happen, diversification[2] weakens and portfolios can behave quite differently from what long-run assumptions suggest.
This raises a question: when tilting, should we explicitly allow for dynamic correlations between asset classes?[3] In other words, should the model change its view of diversification as markets become more stressed?
At first sight, the answer seems obvious. Given that correlation structures change under strain, allowing for that should give a more realistic reflection of what’s happening in markets. In practice, though, the decision isn’t so straightforward.
How do dynamic correlations impact asset allocation?
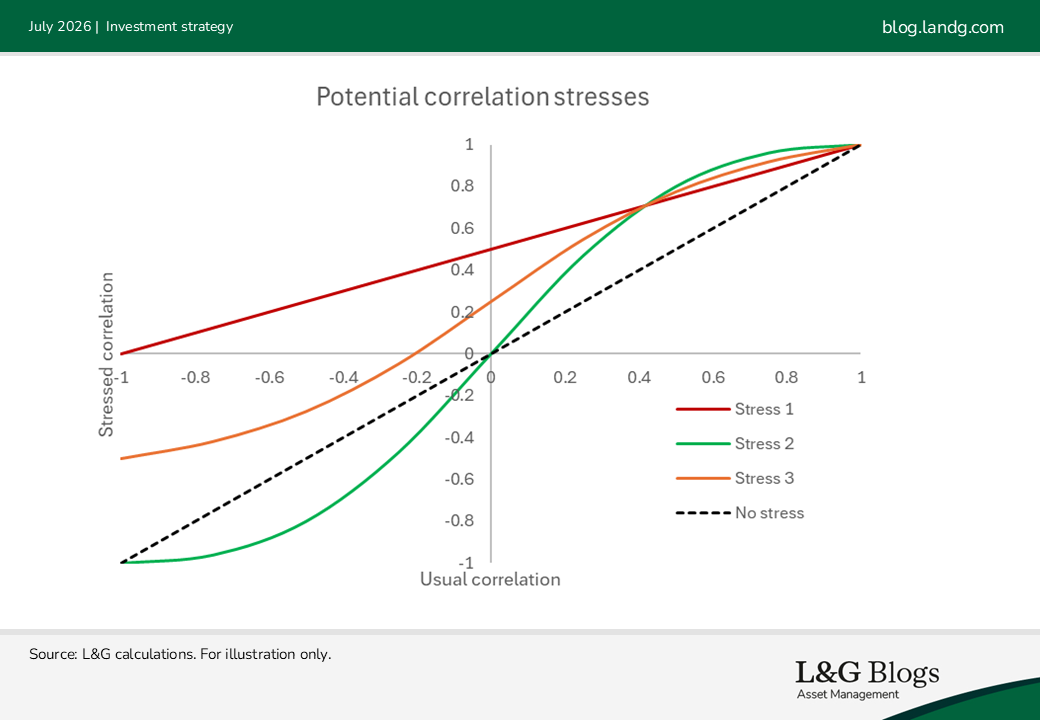
To explore this question, I considered three purely illustrative ways observed historic correlations might shift under stress scenarios, holding expected returns and volatilities fixed:
- Stress 1 shifts the correlations closer to one and ensures they’re always positive
- Stress 2 makes positive correlations more positive and negative correlations more negative
- Stress 3 is an average of stresses 1 and 2
These aren’t forecasts; they’re deliberately stylised tests that show how sensitive tilts can be to different correlation shifts. The stresses are shown below:
After applying these stresses we perform a further step to ensure the resulting correlation matrix is mathematically valid[4]. The chart below shows the impact of the three stresses on a particular SAA:
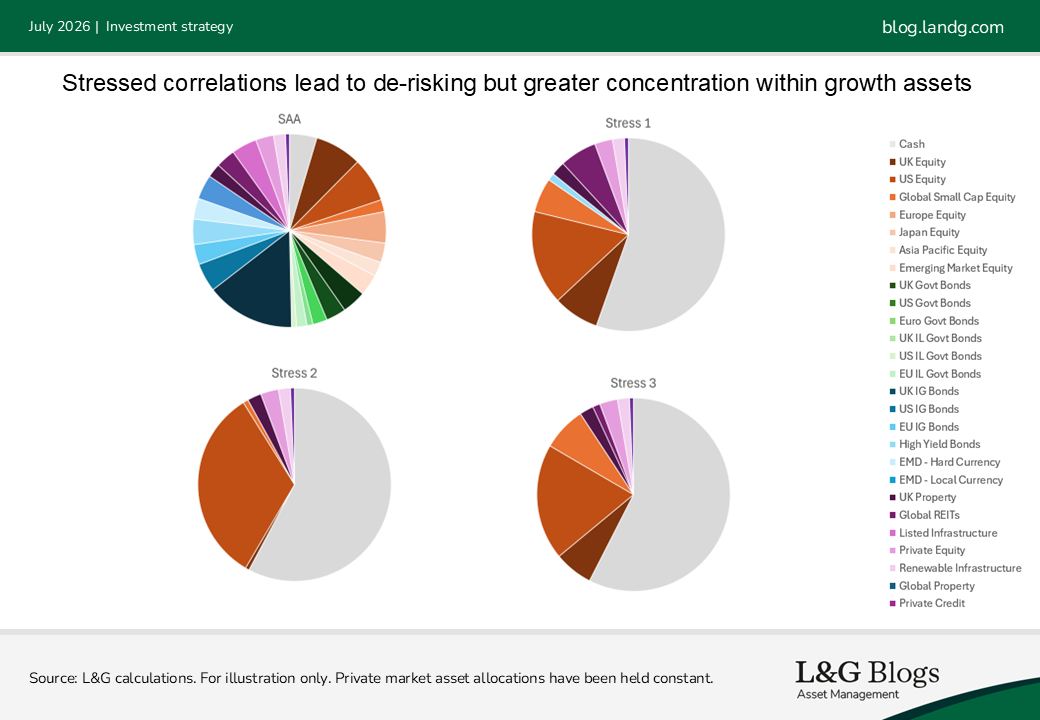
There are two key observations:
- Growth assets become much more concentrated by asset class (mostly in US equities in these examples)
- The portfolios de-risk (into cash)
Concentration
For (1), this makes sense on the surface, since there is less potential benefit to diversification. But another factor matters just as much: during such turbulence there is increased uncertainty around the values of all the inputs (expected returns, volatilities, correlations) used in the optimisation.
In the face of uncertainty as to the state of the world, techniques such as “Enhanced Portfolio Optimisation” actually use shrunken correlations to create more robust portfolios[5]. This turns out to be a powerful way of allowing for noisy inputs – please see the footnote[6] or this paper for further technical details.
The upshot is that although correlations rise in a stress, so does parameter uncertainty and this promotes reducing correlations for portfolio construction purposes i.e. acting in the opposite direction. The important distinction is between estimating what correlations are doing and deciding what correlations to feed into an optimiser.
Another relevant issue is that correlations themselves are especially hard to pin down, which makes implementing dynamism challenging even if it were a good idea. There are also many more correlations than expected returns or volatilities (for example, with 25 asset classes you have 300 correlation pairs to change[7]) and they are noisy in small samples.
De-risking
For (2), as correlations rise between risky assets, diversification falls, and the optimiser reduces exposure to risky assets. That makes sense. But this is directionally the same effect that our MATRIX model already allows for by capturing the higher volatility of asset classes likely to manifest during a stress. That isn’t double counting, but it also doesn’t add a new feature[8]. In practice, the “optimal” degree of de-risking is very difficult to determine, and may be constrained by implementation or governance considerations anyway, such as tracking error budgets.
What this means in practice
There’s no perfect model when it comes to tilting portfolios. However, we believe that keeping correlations static for tilting purposes is a sensible choice given that:
- Broader parameter (input) uncertainty tends to increase exactly when correlations spike, and an effective way to deal with this uncertainty is to reduce correlations
- MATRIX already has a mechanism that recognises heightened risk in stress events
Our choice may change (we’re always looking to improve our models), but for now we think that when it comes to correlations, robustness is a better guide than responsiveness.
[1] Multi Asset Tilting with Risk-aware Integration eXplorer
[2] It should be noted that diversification is no guarantee against a loss in a declining market.
[3] This is a different question to whether we should allow for fat tails in constructing SAAs (which we do).
[4] We use Higham’s algorithm to find the closest correlation matrix that is positive semi-definite.
[5] This is something we use when expressing the SAA as the solution to a mean-variance optimisation. We typically shrink correlations by 50% before doing so since EPO tends to give more balanced portfolios that are a better proxy than MVO for our more complex processes for generating SAAs.
[6] EPO works to reduce the estimated Sharpe ratios of the least important principal components of the covariance matrix, which tend to be the source of instability. This could be achieved by increasing their estimated volatilities, but it turns out that this is the same as shrinking correlations of the original assets toward zero.
[7] Although you could try to assume a mapping (like I did with the three stress functions earlier), determining an appropriate mapping and how that varies with macroeconomic conditions is almost as difficult.
[8] and investors may already be sceptical that de-risking in a stress is a wise move.


Recommended content for you
Learn more about our business
We are one of the world's largest asset managers, with capabilities across asset classes to meet our clients' objectives and a longstanding commitment to responsible investing.