Disclaimer: Views in this blog do not promote, and are not directly connected to any L&G product or service. Views are from a range of L&G investment professionals, may be specific to an author’s particular investment region or desk, and do not necessarily reflect the views of L&G. For investment professionals only.
Open- vs closed-ended funds – do the returns differ?
As more investors seek exposure to private markets, we examine whether the choice between open- and closed-ended funds matters for performance.
Demand for private market assets from an increasing number of investors has grown strongly in recent years, driven by DC pension and wealth clients.
Historically, this investor base has been exposed to more liquid vehicles, contrasting with the closed-ended, general partnership structure traditionally used by private market managers. In response, there has been an increase in semi-liquid product launches over the last two years, including open-ended funds, business development companies (BDCs), long-term alternative funds (LTAFs), and interval funds.
As these ‘semi-liquid’ funds proliferate, we’ve heard some investors question whether better liquidity provisions may imply sacrificing returns. So, we looked at the long-term data – where it’s available – and examined whether closed-ended structures have consistently offered different historical performance than open-ended counterparts*.
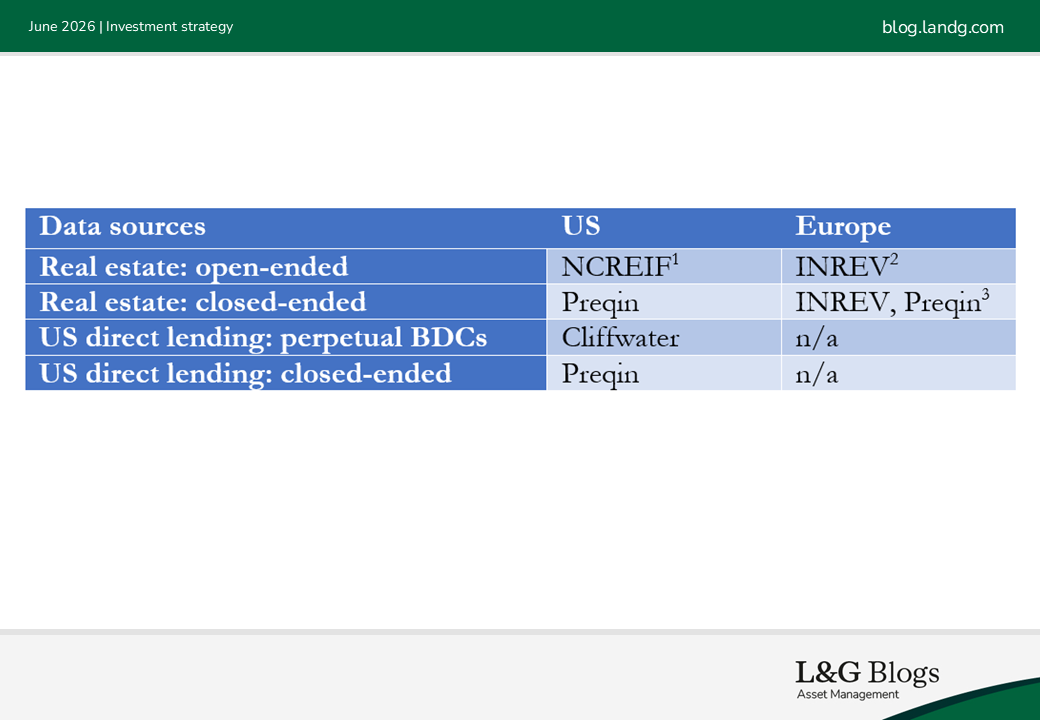
We focused our analysis on two areas – US and European real estate, and US direct lending, with our data sources for both outlined in the table below.
Before delving into the data, a couple of things to note:
· Real estate has a long history of offering both open- and closed-ended funds. As such we were able to source long-term open- and closed-ended performance statistics from various data providers.
· US retail investors can gain exposure to direct lending through BDCs. These offer liquidity via either publicly traded shares, or periodic redemptions. Detailed investment data is available from quarterly BDC regulatory filings.
US real estate
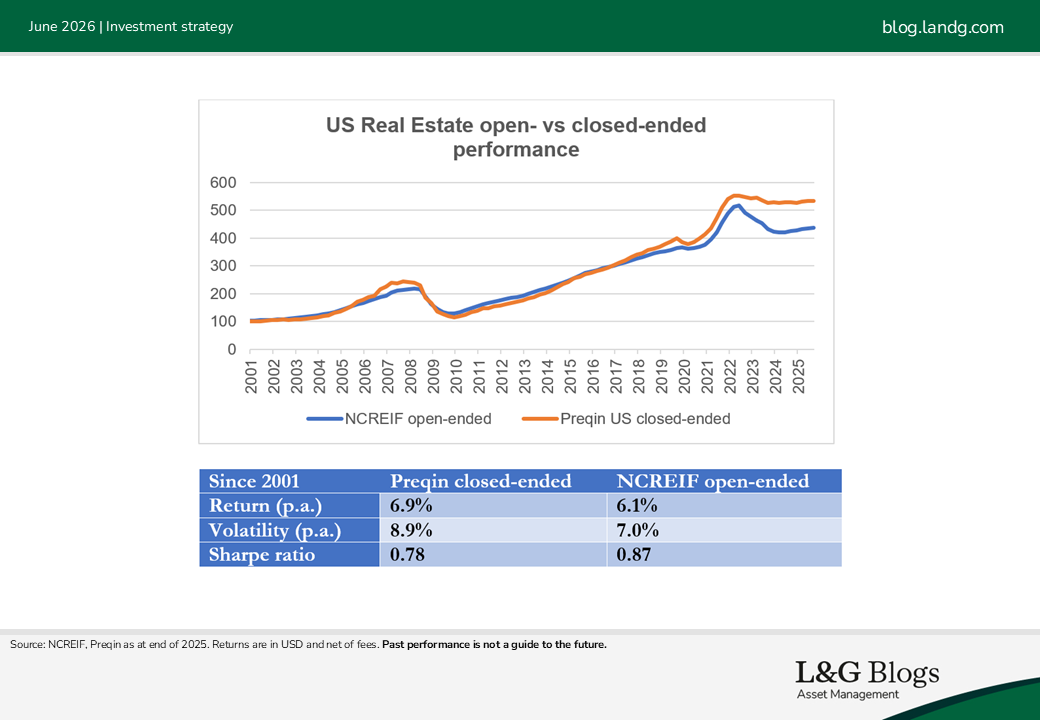
We compared the performance of the NCREIF open-ended fund index versus Preqin’s US Real Estate closed-ended index since 2001. The expectation was that the Preqin index would outperform.
Indeed, closed-ended real estate funds tend to have a higher risk profile. They may be tilted towards single-sector strategies, utilise higher leverage and invest in more complex assets. This contrasts with open-ended funds, which are often diversified, multi-sector strategies focusing on income generation.
Addressing the data, both indices were roughly in line with each other between 2001 and 2018, after which the Preqin index started to outperform meaningfully. Detailed performance attribution is not possible due to a lack of information from Preqin’s index constituents. It’s possible that open-ended funds suffered greater write-downs during the recent correction as they are more ‘sensitive’ to market movements. Saying this, the open-ended US real estate index did better on a risk-adjusted basis – perhaps benefiting from greater portfolio diversification^.
European real estate
We analysed European real estate data sourced from INREV’s open-ended and closed-ended indices as well as Preqin’s European Real Estate close-ended indices. The results were mixed.
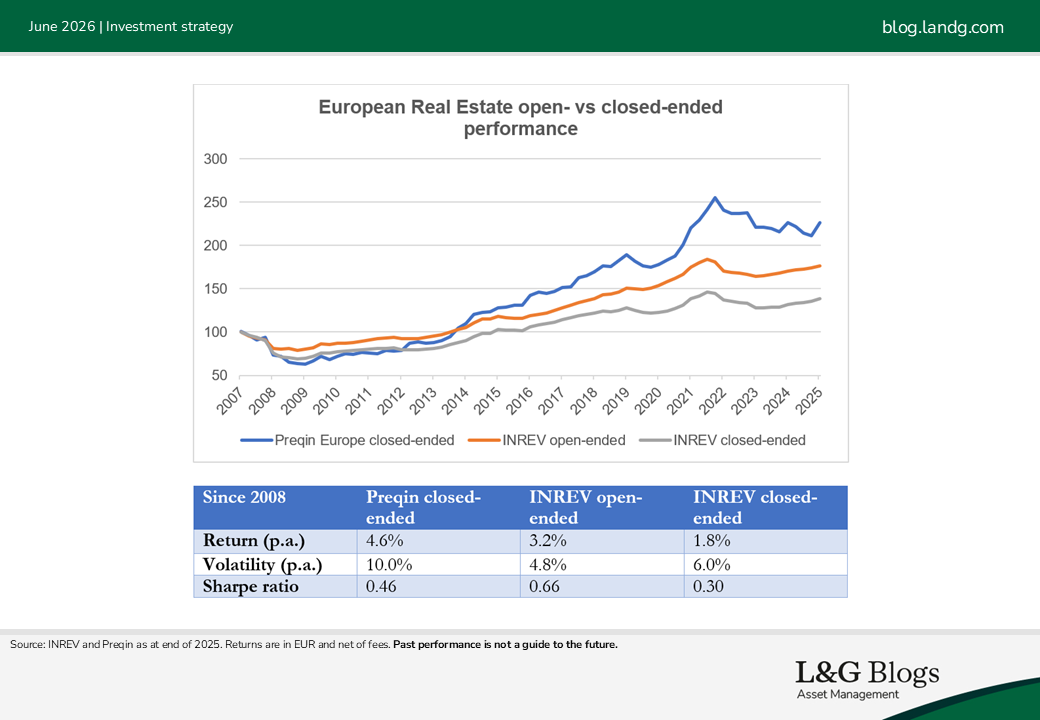
Given the higher risk profile, we expected to see the Preqin index underperform the INREV open-ended index during the 2008 Global Financial Crisis and over 2022-2023 while then strongly outperforming in other years. This enabled the Preqin closed-ended index to deliver a better absolute but less superior risk-adjusted return than the open-ended index.
Sector allocation can be a big return driver
In Europe, structural and sectoral differences have played a larger role in shaping outcomes. There was significant return dispersion across the sectors where industrials and residential notably outperformed offices and retail in the last 10 years.
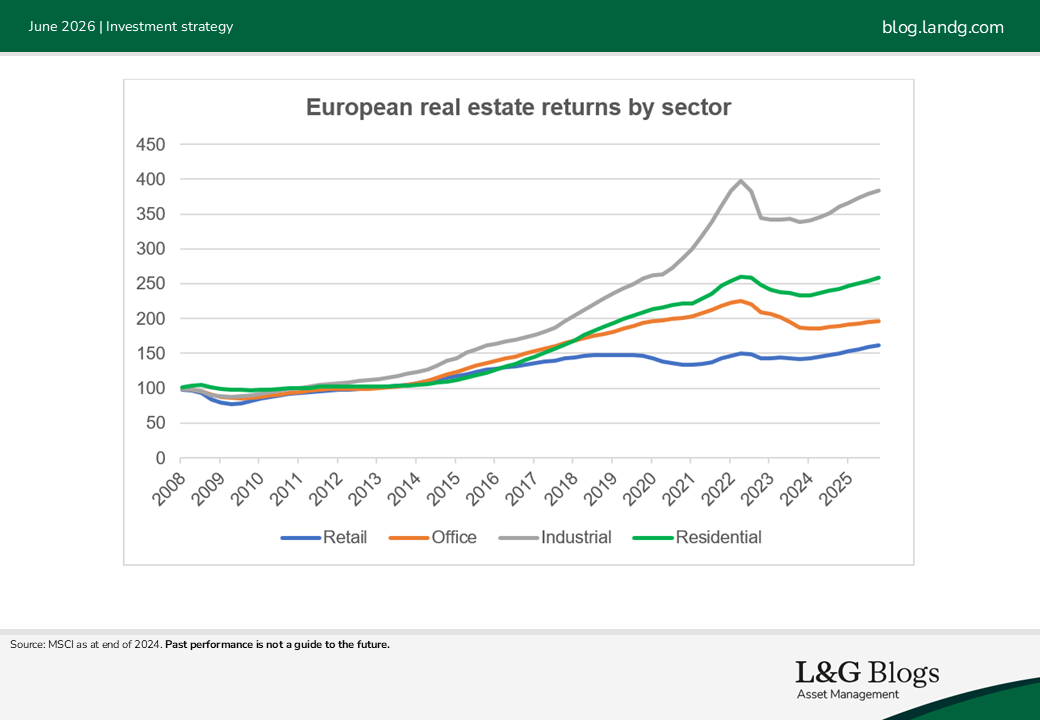
As INREV provides historical sector split data we were able to analyse sector allocation impact in detail. We estimate that sector allocation accounts for c.90% of INREV close-ended index underperformance over the last 15 years. The remaining difference is due to other factors such as fees, country allocation and manager skill.
Up to mid-2010s, closed-ended European funds were strongly biased to retail real estate. Average allocation between 2010 and 2018 was c.50%. Although much reduced since, at the end of 2025 the average retail allocation of closed-ended real estate funds was still notably higher than open-ended funds (15% vs 10%). This is primarily driven by retail specialist funds that don’t diversify into other sectors. It is not, therefore, a reflection on fund liquidity or manager skill.
BDCs vs closed-ended funds
Cliffwater, which provides direct lending data in addition to being a BDC manager itself, usefully produces an index that measures BDC performance on a levered, net-of-fees basis. This enables a consistent comparison with Preqin’s closed-ended data.
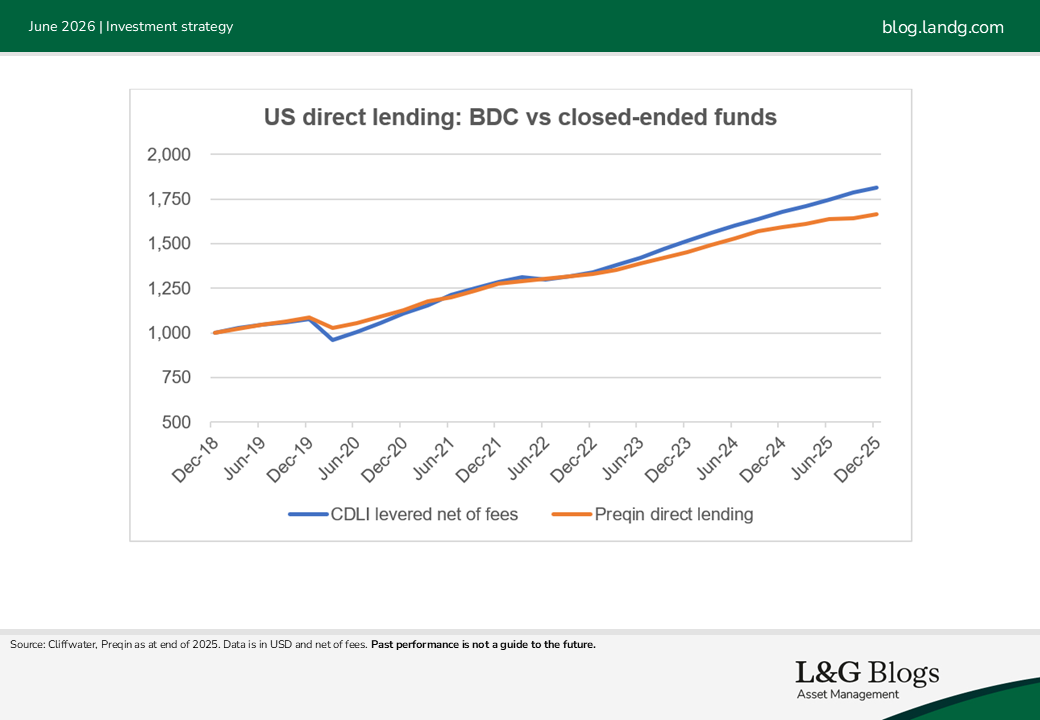
We do not have sufficiently granular data to get a good understanding of why BDCs outperformed closed-ended direct lending funds. One potential driver could be leverage. Based on filings data, BDC leverage is around 0.5x on average (debt/capital). Closed-ended funds do not publish their financial information, but research reports and fund finance transactions suggest they deploy lower leverage. Another factor could be size – BDCs are expected to be more focused on mid-market lending, whereas closed-ended funds have increased their exposure to large and mega-cap borrowers where strong competition has compressed spreads in recent years.
The takeaway
So, does locking up capital improve returns? The evidence suggests not consistently.
The idea that investors must sacrifice returns for liquidity is not strongly supported by the data.
Across real estate and direct lending, we find no consistent evidence that closed-ended structures deliver a structural performance advantage. In fact, much of the variation in outcomes can be explained by factors such as sector allocation – rather than whether capital is locked up.
This suggests the debate may be misplaced: what matters most is what you invest in, not how the fund is structured.
*Past performance is not a guide to the future.
^ It should be noted that diversification is no guarantee against a loss in a declining market.
Assumptions, opinions, and estimates are provided for illustrative purposes only. There is no guarantee that any forecast will come to pass.
[1]NCREIF (National Council of Real Estate Investment Fiduciaries) is the leading provider of US commercial real estate performance, with history going back to 1978.
[2]INREV (European Association for Investors In Non-Listed Real Estate Vehicles) is a leading European real estate platform. Its database contains over 500 vehicles with AUM of nearly €475bn. Its quarterly performance index has 20 years of history.
[3]Preqin (part of BlackRock) is a global leader in private market data and analytics covering a range of asset classes. Its quarterly indices provide time-weighted return data on closed-ended funds.

Recommended content for you
Learn more about our business
We are one of the world's largest asset managers, with capabilities across asset classes to meet our clients' objectives and a longstanding commitment to responsible investing.
