Disclaimer: Views in this blog do not promote, and are not directly connected to any L&G product or service. Views are from a range of L&G investment professionals, may be specific to an author’s particular investment region or desk, and do not necessarily reflect the views of L&G. For investment professionals only.
How equal weighting can tackle concentration risk
By selecting an equal-weight version of a major equity index, investors can reduce concentration risk and access diversified sectors, in our view.

This article is an extract from our Q2 2026 ETF outlook.
Key takeaways:
|
Equity concentration risk is on the rise. With the top 10 constituents of the S&P 500 accounting for almost 40% of the total index weighting,[1] investors have found themselves exposed to severe drawdowns during periods of market stress. The fact that the majority of those top 10 operate in one sector – information technology – further amplifies the risk.
Same holdings, better diversification
In our view, one important way of diversifying to mitigate this risk is to use an equal-weighted investment strategy. This allows investors to access the same underlying pool of constituents as they would find in a market-cap-weighted index, but in a way that provides a much broader spread of exposures.
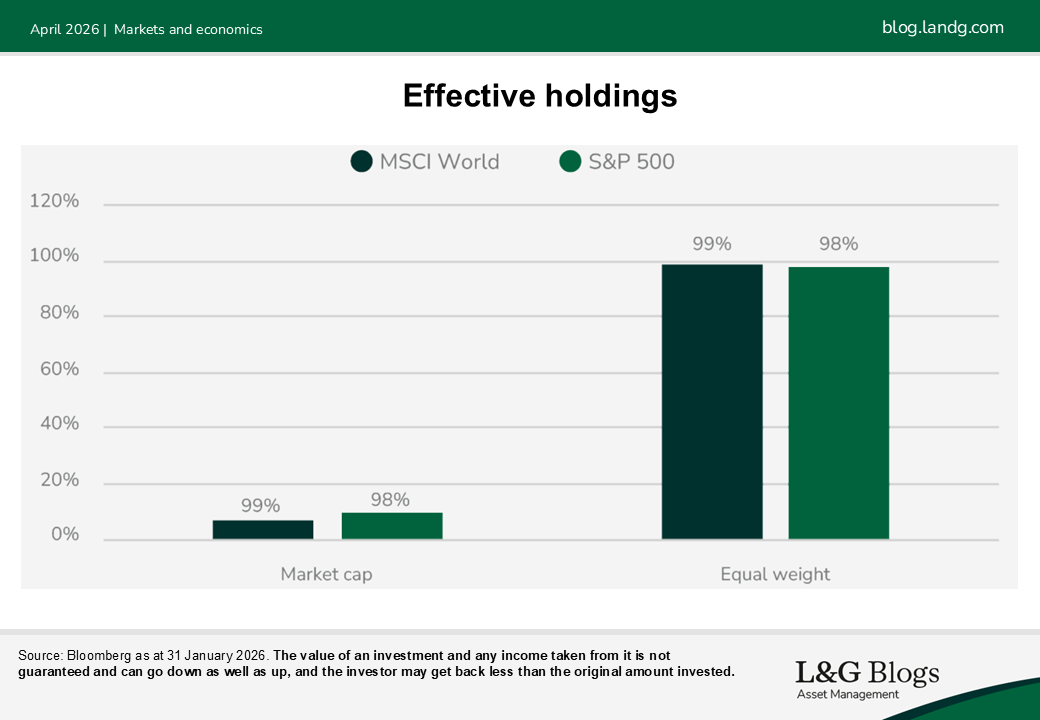
Below we show how this plays out with the MSCI World and S&P 500. In both examples, the effective number of holdings[2] in the marketcap-weighted versions is comfortably below 10% of the total. In practice, this means that the 500 top US companies ostensibly represented by the S&P 500 is effectively reduced to about 35 companies.
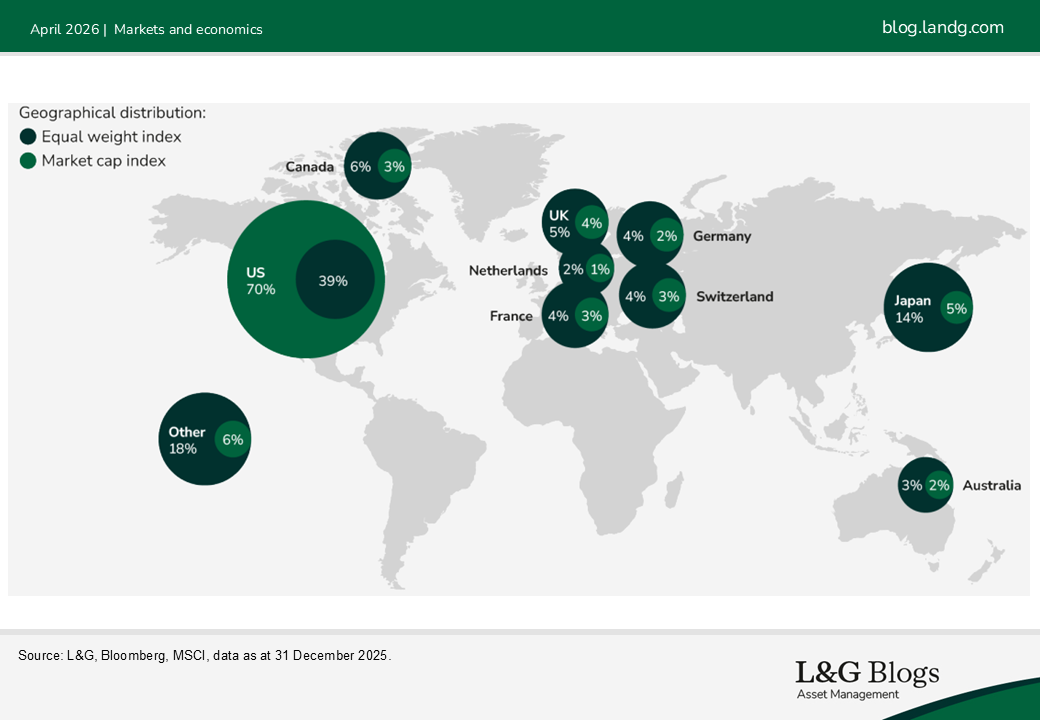
In the case of a ‘global’ index such as the MSCI World, it’s important to note that market-cap weighting often results in a heavy skew towards the US, with very modest exposure to other regions. Equal weighting improves regional diversification, as shown in the map chart below.
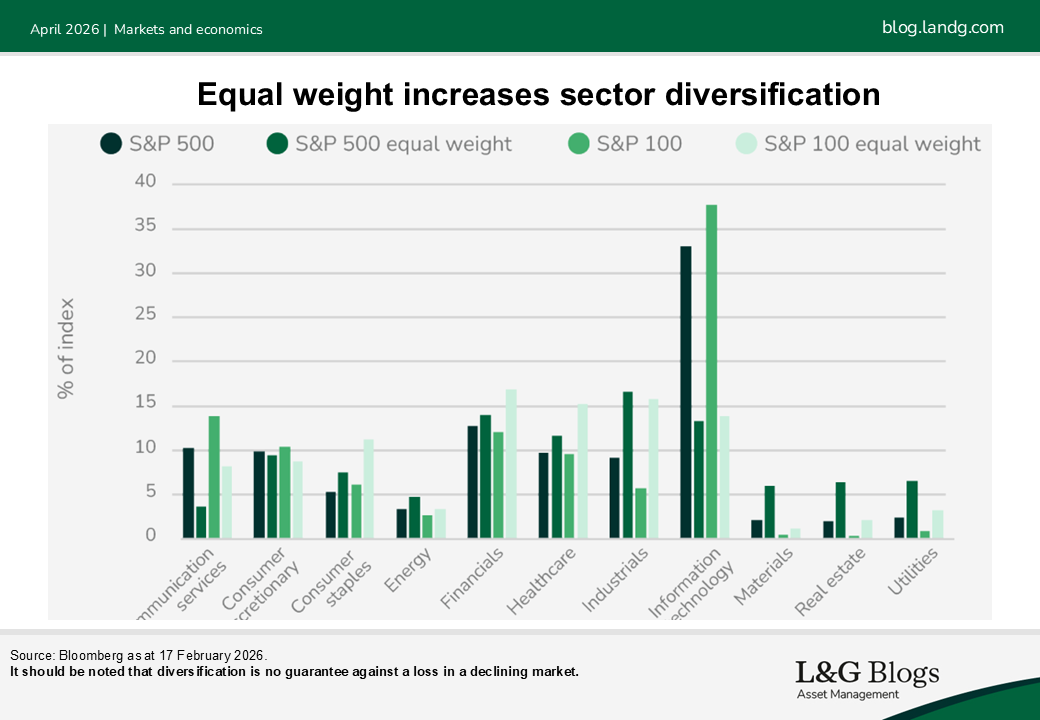
As well as enhancing diversification in terms of the number of companies an index effectively represents and geographical spread, equal weighting can also increase sectoral diversification. In a large company regional index such as the S&P 100, it’s worth adding that this doesn’t alter the liquidity profile of the portfolio.
Again using the market-cap weighted MSCI World and S&P 500 as examples, the technology sector currently accounts for over a third of both. In the equal-weight versions, exposure to this sector is rebased in line with healthcare, industrials and financials in the range of 11% to 16%, providing a balanced exposure of cyclical and defensive sectors.
Increasing the representation of sectors outside technology also results in cheaper valuations in aggregate across the portfolio.
In the market-cap weighted S&P 500 the price-to-earnings ratio is 26x, which falls to 21x for the equal-weight version. For the S&P 500, the comparison is 28x for the market-cap version and 21x for the equal-weight version[3].
Equal weight outperforms in recent downturn
In November, we saw market-cap weighted US equity indices sell off heavily amid concerns over the future profits of software companies given advances in AI. Thanks to their greater diversification and reduced single-sector exposure, equal weight portfolios recovered better in this period.
For investors who wish to consider accessing the dynamism and return potential of the US equity market without being beholden to the daily ups and downs of the AI narrative, we believe equal weight is a compelling option.
This article is an extract from our Q2 2026 ETF outlook.
[1] Source: Bloomberg, the weight of the top 10 holdings of the S&P 500 stood at 38% at as 31 January 2026.
[2] ‘Effective number of holdings’ is a concentration measure in the form of the reciprocal of the Herfindahl-Hirschman Index. Effective number of holdings = 1/HHIor 1/sum(squared stock weights).
[3] Source: Bloomberg as at 17 February, Bloomberg estimate P/E ratio
It should be noted that diversification is no guarantee against a loss in a declining market.

Recommended content for you
Learn more about our business
We are one of the world's largest asset managers, with capabilities across asset classes to meet our clients' objectives and a longstanding commitment to responsible investing.
