Disclaimer: Views in this blog do not promote, and are not directly connected to any L&G product or service. Views are from a range of L&G investment professionals, may be specific to an author’s particular investment region or desk, and do not necessarily reflect the views of L&G. For investment professionals only.
Equal-weight US equities are ahead YTD. What changed?
We believe equal weight may be an appropriate response to an environment of resilient growth, elevated valuations and a shift in market leadership.

Key takeaways
|
It’d be easy to miss it amid all the other developments, but this month the EW versions of the S&P 500 and S&P 100 indices overtook their market-cap-weighted equivalents by year-to-date return.[1] What happened?
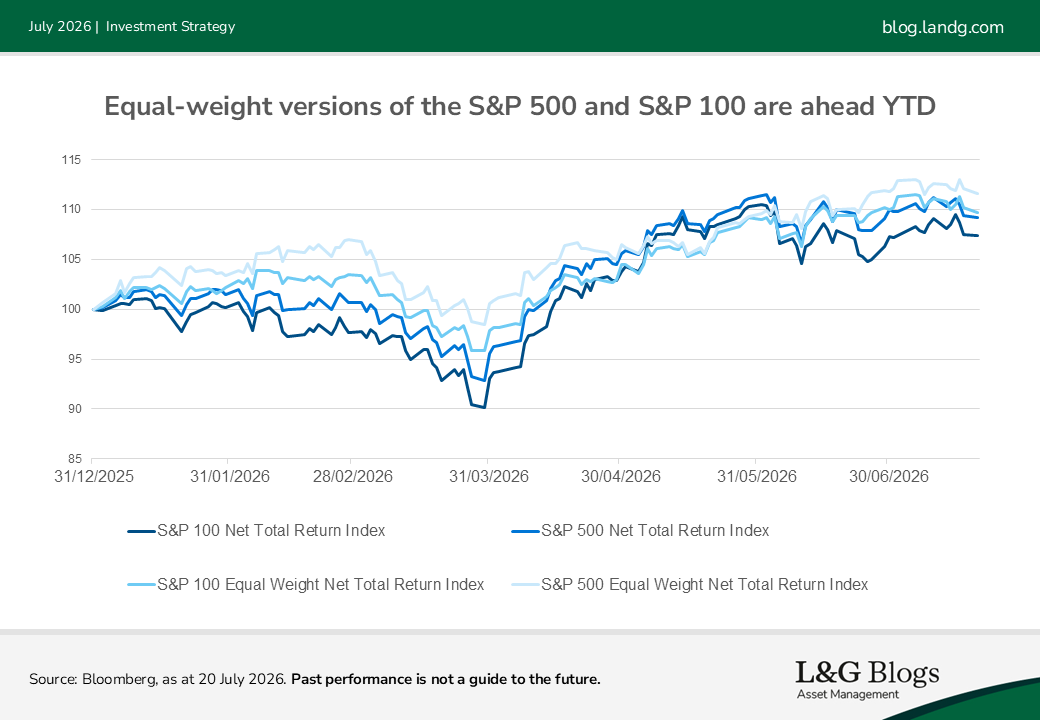
Starting with the S&P 100, the market-cap-weighted version led the EW version within the IT/mega-cap sector thanks to its heavy tilt towards the likes of Nvidia*, Apple* and Microsoft*. However, the massive overweight in mega-caps means any periods of underperformance are amplified. Meanwhile, the EW version has a broader IT sector exposure, which has benefited from the strong recent performance of smaller companies within the sector such as Advanced Micro Devices*, Cisco Systems* and Texas Instruments*. These companies have been recent beneficiaries of the ongoing evolution of the AI narrative, leading to a period of outperformance versus the sector giants.[2]
Turning to the S&P 500, the same theme emerges. Despite a structural underweight to the largest benchmark sector – IT – security selection contributed to the outperformance of the EW index as some smaller IT holdings dramatically outperformed the sector average. Sandisk* was the standout performer of the period, driven by a succession of very strong earnings results. The EW index’s greater exposure to non-IT names also helped, specifically industrials and financials.[3]
This recent change in leadership between market cap weight and EW has focused attention on the potential benefits of a more balanced approach to the US equity market.
The concentration issue
The largest US companies remain a powerful force in global markets, but that strength creates a concentration challenge. In late May 2026, the top 10 stocks accounted for 53% of the S&P 100, and 39% of the S&P 500.[4] In the S&P 100 EW, the same measure was structurally capped at 10% and 2.7% in the S&P 500 EW.
This matters because market-cap weighted indices allocate more to companies whose prices have already risen. That can be helpful when leadership is narrow and persistent, but it also increases sensitivity to earnings disappointment, valuation compression or sentiment shifts in a small number of stocks.
With AI-related expectations still vital for market direction, investors may want exposure to US large caps without allowing a handful of companies to dominate portfolio outcomes.
Capturing the leadership shift
The potential appeal of EW rises when market leadership shifts away from a handful of companies within a single sector. If only the very largest stocks are driving returns, a cap-weighted index naturally benefits. If returns spread across sectors, as we’ve seen across industrials and financials, an equal-weight approach may be better positioned to capture that wider participation.
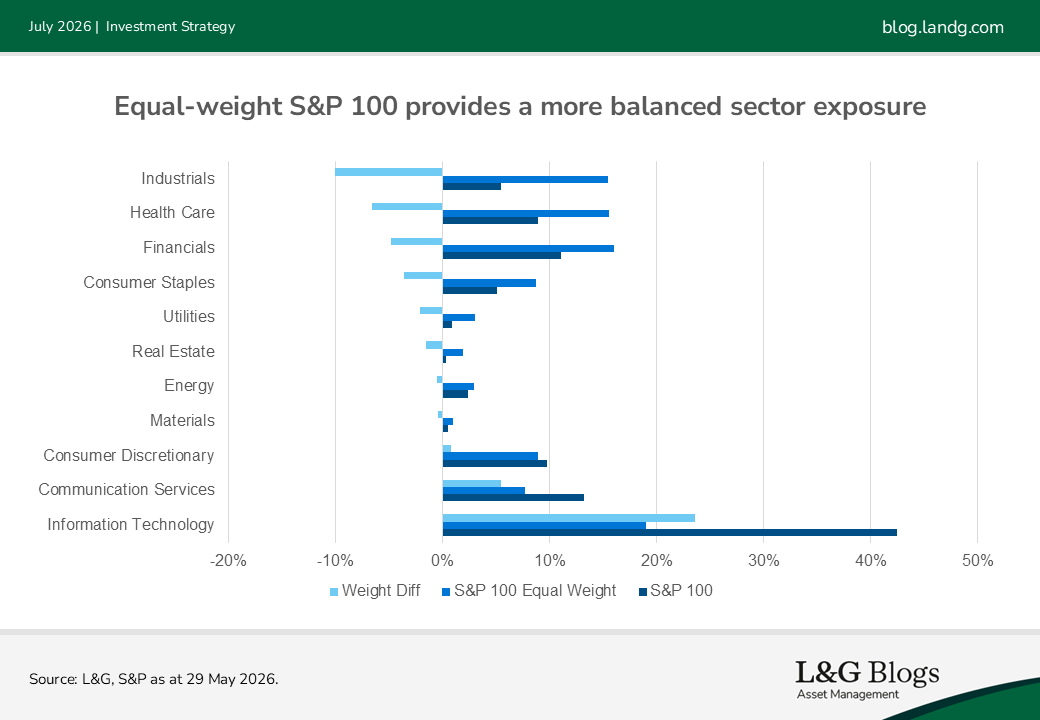
To 20 July 2026, technology contributed 4.9 percentage points to the equal-weight index’s year-to-date return. However, industrials added 1.7 percentage points and energy added 1.4 percentage points. Technology remained important, but it was not the only source of return.
Valuation and income
The valuation backdrop also potentially supports the case for balance. The chart below shows the persistently lower P/E multiple of the EW version of the S&P 100.
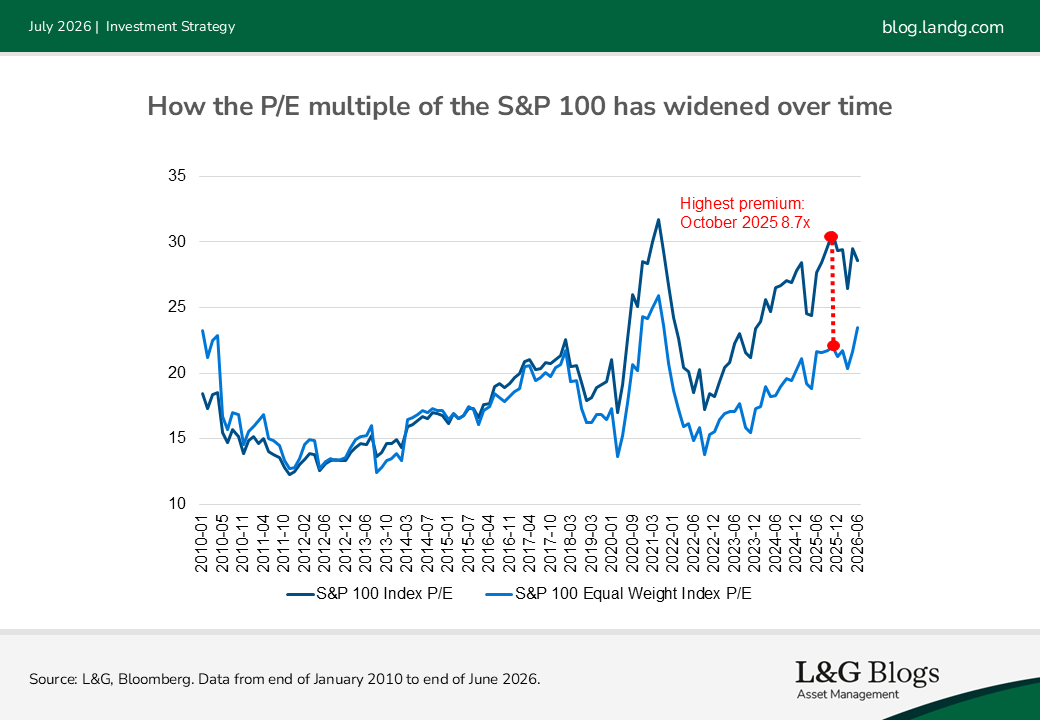
The income picture is similar: in June 2026, the equal-weight index offered a dividend yield advantage of around 0.8 percentage points, helped by lower exposure to low-yielding mega-cap stocks.[5]
A different route to US large caps
Equal weighting is not a move away from US blue-chip companies; it’s a different way of holding them. It still provides exposure to leading US businesses, but gives each stock an equal starting point. This reduces the dominance of mega-cap technology and allows returns to be driven by a broader set of companies and sectors.
For investors seeking continued exposure to leading US companies, an EW index offers a more balanced route – one that may be well suited to an environment of resilient growth, elevated valuations and a shift in market leadership.
*For illustrative purposes only. Reference to a particular security is on a historic basis and does not mean that the security is currently held or will be held within an L&G portfolio. The above information does not constitute a recommendation to buy or sell any security.
[1] Source: Bloomberg, as at 20 July 2026.
[2] Source: Bloomberg, as at 20 July 2026.
[3] Source: Bloomberg, as at 20 July 2026.
[4] Source: L&G, Bloomberg. Data from 31 December 2000 to 29 May 2026
[5] Source: L&G, Bloomberg. Data from end of January 2010 to end of June 2026.

Recommended content for you
Learn more about our business
We are one of the world's largest asset managers, with capabilities across asset classes to meet our clients' objectives and a longstanding commitment to responsible investing.