Disclaimer: Views in this blog do not promote, and are not directly connected to any L&G product or service. Views are from a range of L&G investment professionals, may be specific to an author’s particular investment region or desk, and do not necessarily reflect the views of L&G. For investment professionals only.
Identifying the megatrend drivers of returns
Our 4D framework helps investors look through asset classes and identify the structural forces driving portfolio outcomes, revealing both opportunities and hidden concentrations in private markets.

This article is an extract from our Q4 2026 Asset Allocation outlook.
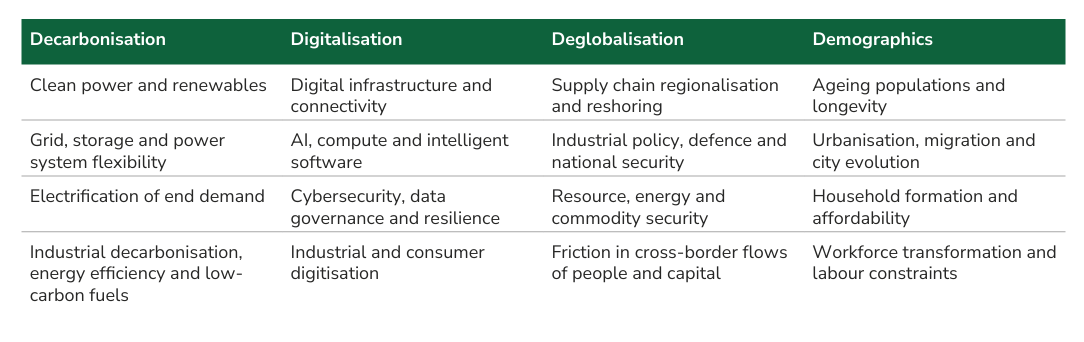
There are four structural forces that we believe will reshape private market portfolios over the long term. We called them the “4Ds”: decarbonisation, digitalisation, deglobalisation and demographics. We have followed up our original work with a scoring framework that would enable investors to assess their portfolio’s alignment to the 4Ds.
More granularity
We have translated the four megatrends into 16 granular sub-trends to enable more nuanced differentiation between return drivers (for example, clean energy generation versus grid upgrade). We then scored the major real asset sectors against the sub-trends on two metrics: “exposure” (how much the trend touches the sector) and “impact” (is the trend a headwind or tailwind for asset performance) over a medium-term (five-year) horizon. For simplicity, we applied equal weights to the 16 sub-trends. The 4D scoring framework allows us to ask: is the portfolio genuinely diversified or are the different strategies all leaning on the same structural driver? Are we deploying capital towards trends most likely to shape long-term returns? What are the hidden concentration risks?
Winning sectors are aligned to several megatrends
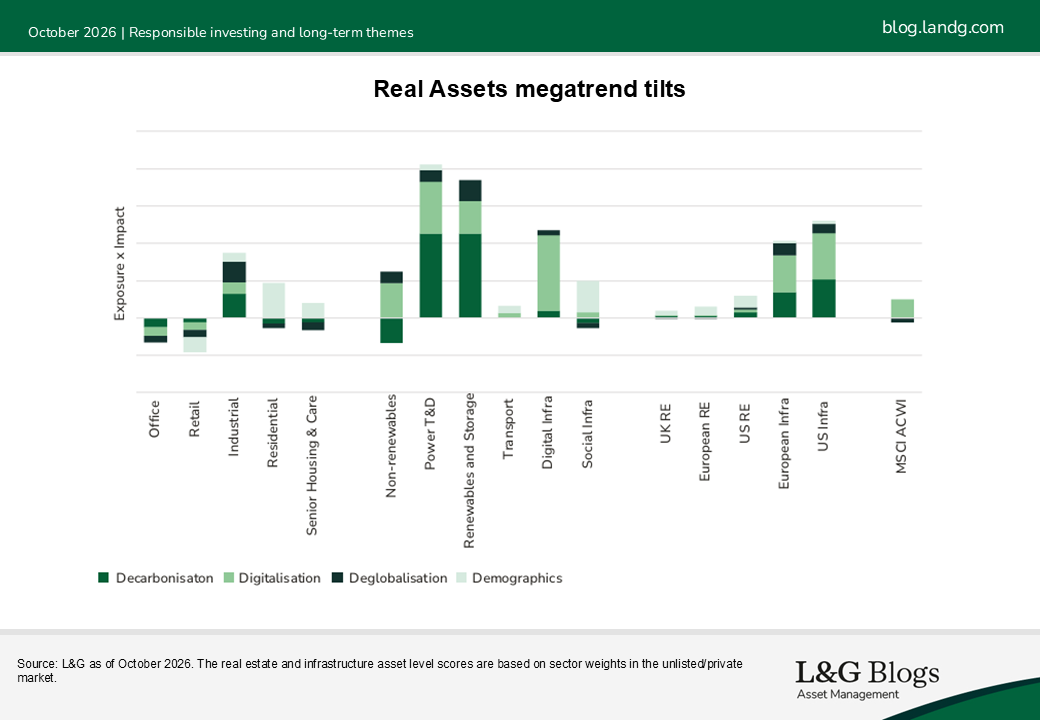
Megatrend alignment is highly uneven across sectors (shown in the chart as the exposure score x impact score[1]). Energy transition infrastructure (grid, renewables and storage) performs the strongest, benefiting from decarbonisation and, increasingly, digitalisation. Industrial real estate is also well-positioned given its exposure to a multitude of trends (data centres, reshoring, urbanisation, e-commerce to name a few). Demographics dominate a distinct cluster: residential, social infrastructure and senior housing.
At the other end, office and retail score less well and drag down the overall score for private real estate given they still account for 25-40% of the asset class. Most real asset sectors outscore broad market equities (represented by MSCI ACWI[2]) which is moderately tilted towards digitalisation given the concentration of semiconductor and AI related stocks.
Scores ≠ investment performance
Under a total-portfolio approach, investors increasingly want to see through individual asset classes to their underlying return drivers. Such transparency is particularly valuable in private markets.
The important caveat here is that these scores do not equate to investment performance. A high score signals a structural tailwind not a guaranteed return. Asset selection, execution, market timing and even luck could all contribute to the investment outcome. A high score could also indicate crowding and the need to be disciplined. Conversely, sectors that score poorly are not uninvestable. In our view, office and retail may offer some of the richest value-add opportunities. The presence of structural headwinds may imply a need for greater selectivity within these sectors.
Ultimately, the 4D scoring framework is not a shortcut to returns but aims to offer investors a sharper lens into their exposure to these long-term trends so asset allocation can be aligned intentionally rather than by accident.
This article is an extract from our Q4 2026 Asset Allocation outlook.
The value of an investment and any income taken from it is not guaranteed and can go down as well as up, and the investor may get back less than the original amount invested. Assumptions, opinions, and estimates are provided for illustrative purposes only. There is no guarantee that any forecasts made will come to pass.
It should be noted that diversification is no guarantee against a loss in a declining market.
[1] We scored exposure on a scale of 1 to 5 and impact from +3 to -3. The scoring is based on our judgement of how each sector’s fundamentals and performance is likely to be affected by the trends over a medium term time horizon.
[2] This varies on a regional level: US and Asian public equities are significantly more exposed to digitalisation than European equities.

Recommended content for you
Learn more about our business
We are one of the world's largest asset managers, with capabilities across asset classes to meet our clients' objectives and a longstanding commitment to responsible investing.