
Disclaimer: Views in this blog do not promote, and are not directly connected to any L&G product or service. Views are from a range of L&G investment professionals, may be specific to an author’s particular investment region or desk, and do not necessarily reflect the views of L&G. For investment professionals only.
Private markets in Q3: Decoding the headlines
In this two-part blog series, we present our latest quarterly private markets update based on the most recent available data. To begin, we discuss the macro environment, capital raising trends, asset pricing and relative value versus the public market.

Private markets are entering the remainder of 2026 with a finely balanced outlook, in our view.
Economic growth has proved more resilient than expected, but persistent inflation risks and higher long-term interest rates continue to constrain valuations. At the same time, artificial intelligence (AI), energy security and infrastructure investments are creating sources of demand as well as risks.
We believe this environment calls for greater selectivity rather than broad caution. Assets and segments with durable demand, recurring income and protection against inflation should be better placed than investments that rely on substantial leverage, multiple expansion or a faster return to much lower interest rates.
Performance remains uneven
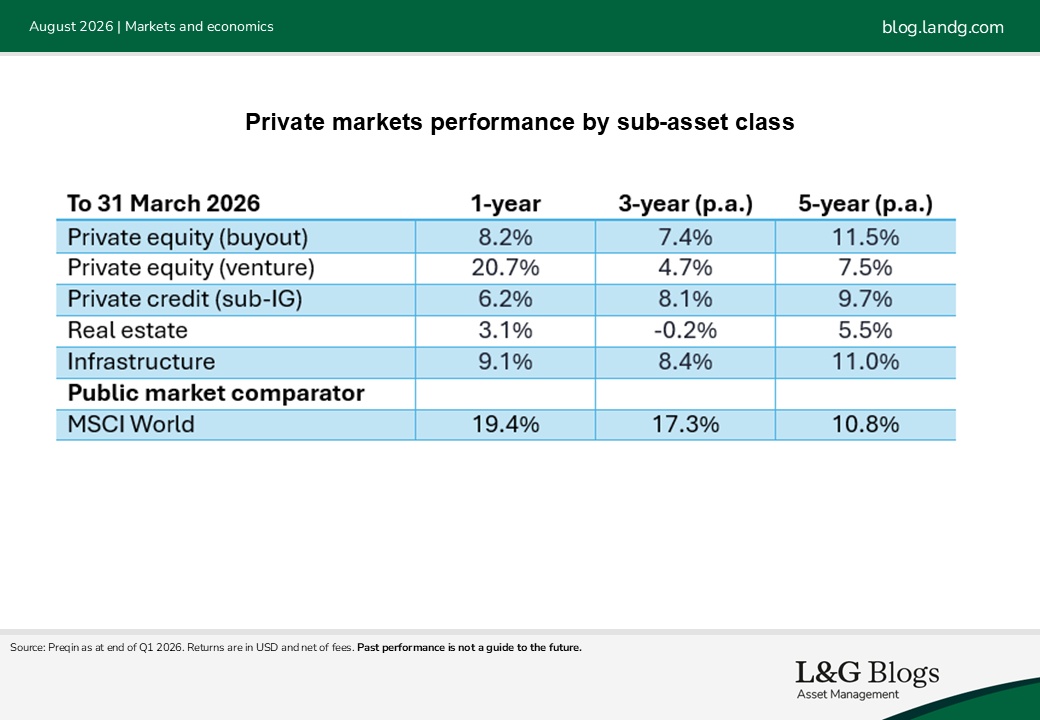
Performance between private market sectors has diverged (based on data from closed-ended funds). Venture capital led over the year to March 2026, supported by AI-related valuation gains, but remained slightly below its previous peak after the post-2021 correction.
Infrastructure has delivered more consistent performance, producing returns of 8% to 11% over the one-, three- and five-year periods. We expect inflation-linked revenues and demand for hard assets to be the main contributors.
Private equity performance has been comparatively subdued and has lagged public equities over the last five years. Meanwhile, private credit returns have started to moderate as spreads have compressed and loan marks are beginning to reflect AI disruption fears. Elsewhere, the recovery in real estate has stalled as higher bond yields have again put pressure on pricing.
Reports of private credit’s ‘death’ have been exaggerated
Despite dominating headlines this year, private credit continues to draw capital from institutional investors. Thirty funds with more than $1 billion in AUM reached final closes in the first half of 2026 based on Preqin data.
Despite concerns about credit quality and stress among some borrowers, institutional demand for private credit income has remained strong. This is likely, in our view, to have been driven by the recent favourable market dynamic shift towards lenders.
Elsewhere, private equity fundraising has been steady, venture capital has benefited from AI interest and real estate has softened. Infrastructure fundraising fell sharply from 2025, but the comparison is distorted by the timing of several megafund closes in 2025 rather than a collapse in demand.
Relative value requires more than a headline yield
Investment-grade private credit remains one of the more tactically attractive areas. Its yield is significantly above its long-term average because of higher base rates, while the additional spread over comparable public credit has remained resilient.
Direct lending (sub-investment grade private credit) offers the highest absolute yield among the major private asset classes at just under 10%. That yield, however, is less exceptional relative to its own history. Direct lending has grown from a relatively niche market into a mature asset class, reducing the scarcity premium that lenders could previously command.
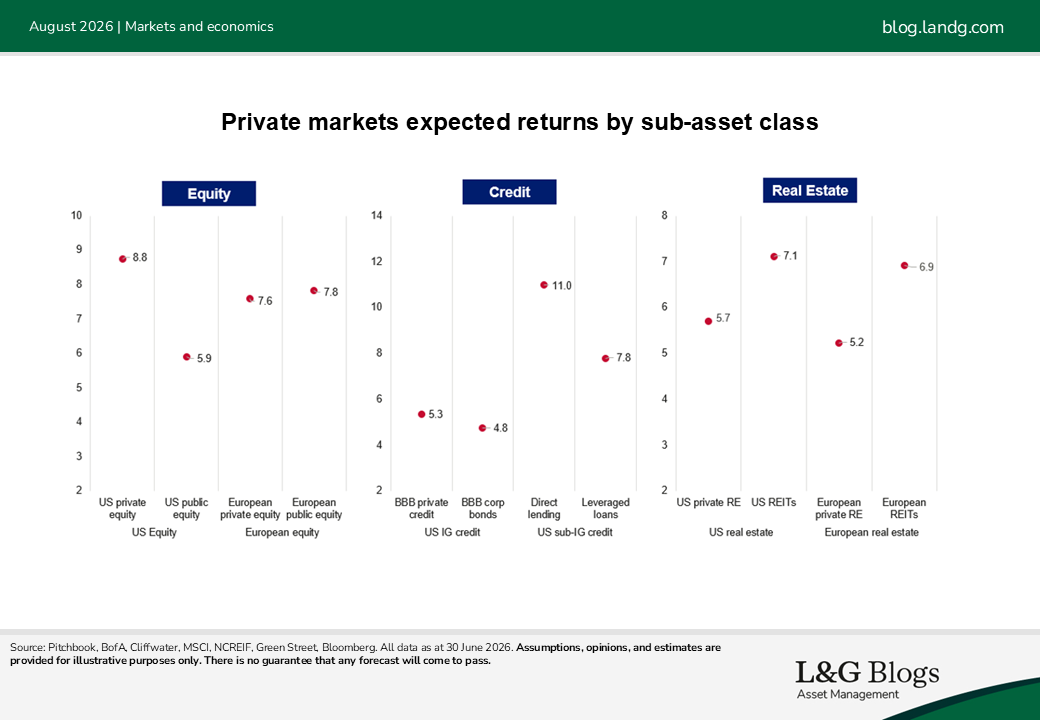
Our analysis also distinguishes between headline asset yield and expected return. To determine the expected return from investing in private market funds (which is how most investors gain exposure), it is necessary to account for fund leverage, fees and (in credit) expected default loss. The comparison with the expected return from an investible public market alternative produces a more representative illiquidity premium than looking at headline yields alone.
Based on this framework, we found that US private equity and private credit (IG and sub-IG) generate the highest illiquidity premium. Real estate investment trusts (REITs), however, appear better value than private real estate, due to higher yields and cheaper debt costs.
In the second part of our blog, we’ll be introducing the concept of our private markets dynamic scorecards, demonstrating how we assess the outlook for each asset class.
*All performance data, unless otherwise stated, is from Preqin as of March 2026.
Assumptions, opinions, and estimates are provided for illustrative purposes only. There is no guarantee that any forecast will come to pass. Past performance is not a guide to the future.

Recommended content for you
Learn more about our business
We are one of the world's largest asset managers, with capabilities across asset classes to meet our clients' objectives and a longstanding commitment to responsible investing.