Disclaimer: Views in this blog do not promote, and are not directly connected to any L&G product or service. Views are from a range of L&G investment professionals, may be specific to an author’s particular investment region or desk, and do not necessarily reflect the views of L&G. For investment professionals only.
Illiquidity, risk aversion and market bubbles: where we are now
Measures of illiquidity are back to COVID-19 levels, but hawkish central bank policy means we're in a very different place today.

During market crises, volatility rises, Valuation at Risk-based models order traders to reduce risk and investors typically focus on capital preservation rather than expected returns.
As a result, liquidity in the overall market tends to dry up.
This can create a vicious circle in which illiquidity creates risk aversion, which creates more illiquidity, and so on – as has occurred in the UK government bond market recently.
Measuring liquidity
There are various ways of measuring liquidity. Daily turnover, depth of order book, bid/offer spreads and average mispricing versus ‘fair value’, the pricing of ‘off the run’ versus ‘on the run’ bonds. The concept of pricing versus fair value is captured in the Bloomberg US government liquidity Index.
I use this index as one of the factors in the Bubble or Heiligenberg Index. Rising illiquidity is a warning signal for bubbles bursting.
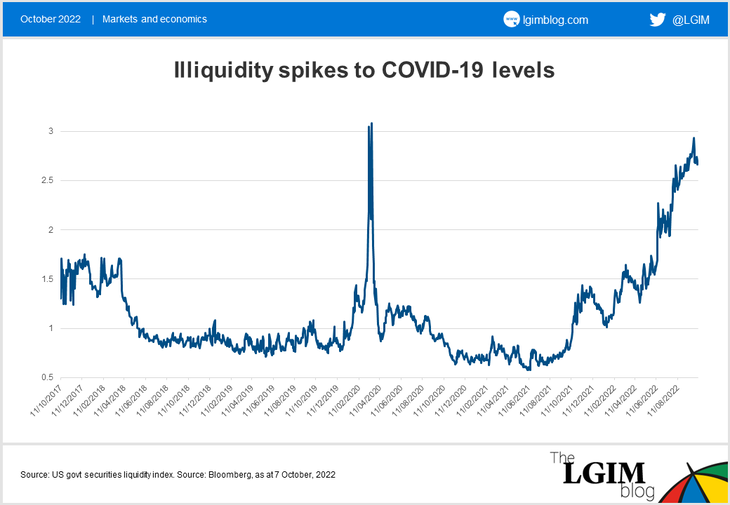
The chart above suggests that illiquidity is currently approaching levels last seen at the onset of COVID-19. Back then, central banks led by the US Federal Reserve were pumping liquidity into markets to support the global economy. This time, they are removing it in a bid to curb rampant inflation.
As a general rule, we believe investors should stop panicking when policymakers intervene to support markets. Because our monetary guardians are now constrained due to their fight against inflation, they look less likely to pivot on market weakness alone.
But as we have seen in the UK, the Bank of England was willing to step up to prevent further dislocations in gilts. So investors can take comfort that, while the bar to action is high, central bankers still seem ready to act in the event of severe market stress.
A whimper, not a bang?
Finally, the ‘Heiligenberg Index’ keeps rising, which normally points towards increased bubble risks. This is surprising and unusual as the equity market is deflating. To be honest the index is unhelpfully coincidental this time; it is constructed as an early indicator, but at the start of the year there was not enough excitement to provide a warning signal.
What do I learn from this? I think current drawdown can’t be really classified as a deflating bubble. There has not been enough exuberance that needs to deflate.
I believe what we see is a textbook cyclical bear market we see in every recession, albeit with unexceptionally strong inflation pressures. Why does this matter? The magnitude of the drawdown is usually smaller in recessions than when a bubble needs to deflate.

Recommended content for you
Learn more about our business
We are one of the world's largest asset managers, with capabilities across asset classes to meet our clients' objectives and a longstanding commitment to responsible investing.
