Disclaimer: Views in this blog do not promote, and are not directly connected to any L&G product or service. Views are from a range of L&G investment professionals, may be specific to an author’s particular investment region or desk, and do not necessarily reflect the views of L&G. For investment professionals only.
CAPE fear?
The elevated CAPE ratio is often cited as evidence that US equities have become too expensive. We examine why the relationship between valuation and future returns may be more nuanced than commonly assumed.

This article is an extract from our Q4 2026 Asset Allocation outlook.
The cyclically adjusted price/earnings ratio (CAPE) is one of the most widely used measures of equity market valuation. Rather than comparing current prices with recent or forecast earnings, it uses the average of the previous 10 years of inflation-adjusted earnings, helping to smooth out the effects of economic cycles and temporary fluctuations in profitability. At 40.5x, the US CAPE currently sits in the 98.9th percentile of its near 150 year history, offering a useful soundbite to those concerned that US equities have moved decisively into bubble territory.
What CAPE can and can’t tell us about future returns
How worried should we be about the elevated level of this measure? We believe there are a number of factors which temper the bearish message some might draw from such an elevated reading, and we review a few of them here. First, the common scatter charts often circulated as evidence of the apparent relationship between starting-point CAPE and subsequent long-term returns (i.e. the higher the starting point multiple, the lower the subsequent return) are built upon shaky statistical foundations. Second, we are currently in a regime of historically rapid earnings per share (EPS) growth. Of course that might not last, but even some tentative extrapolations forward will bring down the CAPE rapidly as the 10-year earnings window shifts. And third, outside of the US, valuations on most measures, CAPE included, are simply not that extended.
Producing a scatter chart of CAPE versus subsequent 10-year real returns creates an apparently compelling inverse relationship: the higher the starting point price-to-earnings (PE) ratio, the lower the subsequent 10 year returns, and vice versa. Such analysis is at the core of the concern around the currently elevated level of the CAPE. However, as my colleague John Southall has discussed at length across a range of blogs, the optics of this chart do not stand up to scrutiny.
First, the apparent relationship rests on significant overlapping of data: the actual number of independent datapoints is relatively small. Second, what counts as cheap or expensive changes through time: a 5% earnings yield would have been expensive in 1995, and thus implied low returns, but now looks average. And third, such analysis rests on a finite pool of data. One hundred years may sound like a reassuringly large dataset, but John argues persuasively that it’s a pool of datapoints which can inflate our confidence in the ability to predict equity returns, which are an inherently volatile asset class.
Beyond those theoretical pushbacks, it is also important to recognise that recent earnings growth may reflect a structural shift rather than a typical point in the cycle.
Across the 150-year Shiller data set, the real earnings compound annual growth rate (CAGR) has been 2.2%. Over the last 10 years, US equities have delivered an earnings CAGR of 9.4%, and over the last three years that rises to 14%. That puts the last three years near the 90th percentile for three-year earnings growth, which is all the more remarkable given that it is not a period of recovery from recession or crisis.
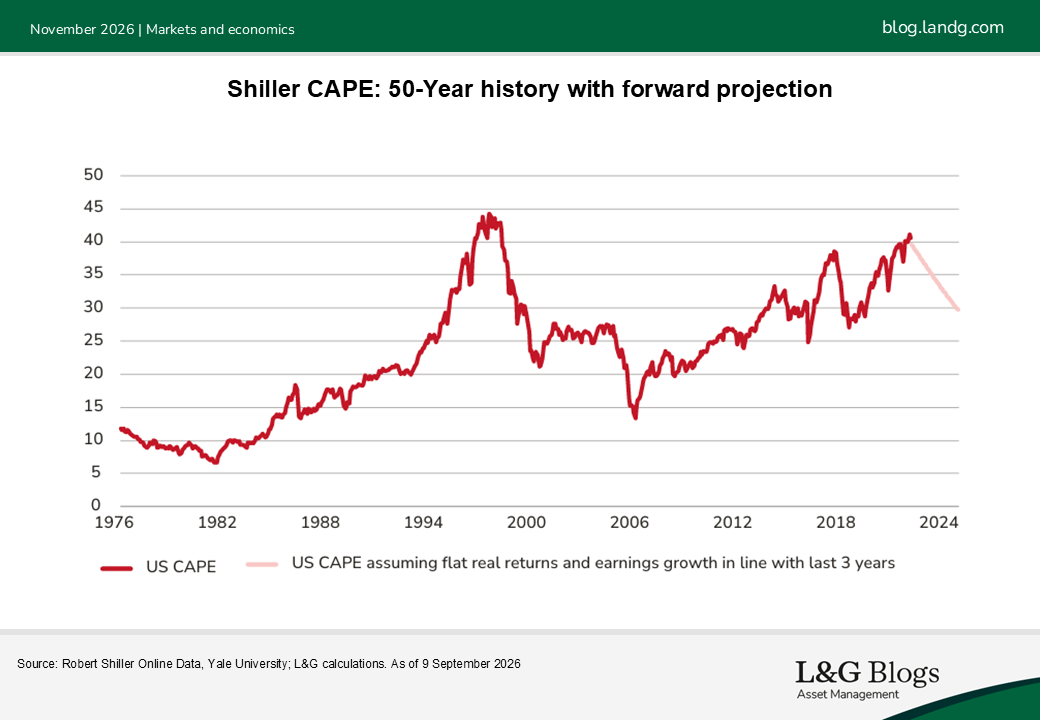
Could earnings growth bring valuations back down?
Looking ahead, this powerful earnings uplift will inevitably start to bring down the elevated CAPE level. By way of example, if the US equity index level tracks inflation higher over the next three years (i.e. is flat in real terms), and US equities deliver the same EPS growth as seen over the past three years, the US CAPE would fall to 29x, putting the valuation in the 20th percentile seen over the last decade. Those are optimistic assumptions on earnings of course, but the simple maths does illustrate the power of earnings to de-rate the US market, even on a CAPE basis.
Finally, given the high weighting in fast growing tech companies today in the US, it feels less appropriate to use an earnings base from a notably different index 10 years ago when computing valuation. Non-US indices have seen less transformation (though the weighting of tech, direct and indirect, has risen in all cases), and here valuation multiples on a CAPE basis are just unremarkable, though moving toward the upper end of historic ranges in some cases.
Finally, given the high weighting in fast growing tech companies today in the US, it feels less appropriate to use an earnings base from a notably different index 10 years ago when computing valuation. Non-US indices have seen less transformation (though the weighting of tech, direct and indirect, has risen in all cases), and here valuation multiples on a CAPE basis are just unremarkable, though moving toward the upper end of historic ranges in some cases.
In Europe, the CAPE is around 20, in China 18 and in Hong Kong less than 10x.[1] Yes, US equities are about 63% of global market cap,[2] but as we often highlight, our own approach to investing continues to highlight diversification, and the opportunities offered by unloved assets. Elevated US valuations are therefore best viewed as a regional phenomenon rather than a definitive verdict on global equity markets. A high US CAPE today is not a stick to beat global equities with.
This article is an extract from our Q4 2026 Asset Allocation outlook.
Assumptions, opinions, and estimates are provided for illustrative purposes only. There is no guarantee that any forecasts made will come to pass.
[1] Source: Siblis Research, June 2026
[2] Source: Siblis Research, June 2026

Recommended content for you
Learn more about our business
We are one of the world's largest asset managers, with capabilities across asset classes to meet our clients' objectives and a longstanding commitment to responsible investing.