Disclaimer: Views in this blog do not promote, and are not directly connected to any L&G product or service. Views are from a range of L&G investment professionals, may be specific to an author’s particular investment region or desk, and do not necessarily reflect the views of L&G. For investment professionals only.
From trade to trends: Unpacking market behaviour
How can recent market volatility be assessed through the broader historical patterns of market behaviour?

The recent changes to US trade policies have dominated headlines and sparked various client conversations.
When we talk to clients such as employers, pension fund trustees and their advisers, their focus tends to be on the long term and looking past the shorter-term noise. Questions mainly relate to whether the risk of US assets has gone up structurally and if the strategic weights to different regions and assets should change.
Nevertheless, it’s inevitable that recent market moves have played a central role in the current attention on US tariffs. But how unusual has market behaviour been so far?
While markets aren’t always efficient, they can provide a barometer of what investors make of a risk, based on all the available information so far.
Examining today through a historical lens
No two market events are identical, but comparing the current situation to historical precedents can provide valuable insights
The recent market movements have been characterised by significant volatility across various asset classes. For example, the S&P 500 dropped about 20% from its mid-February peak through to early April [1] and expectations of future equity volatility hit levels not seen since March 2020 and the peak of COVID-19 uncertainty[2].
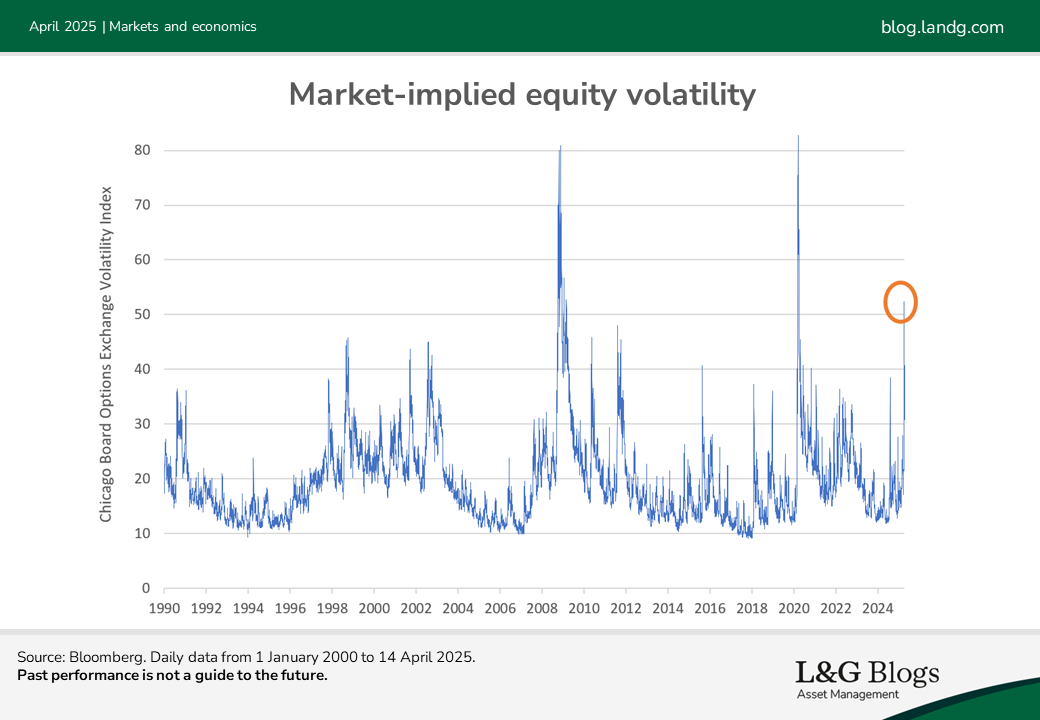
So, how unusual have market moves been so far compared with history?
Looking from the start of 2000 onwards and focusing in on three areas that have attracted the most attention in 2025, we can see how severe the current moves have been, relative to the top 10 events historically.
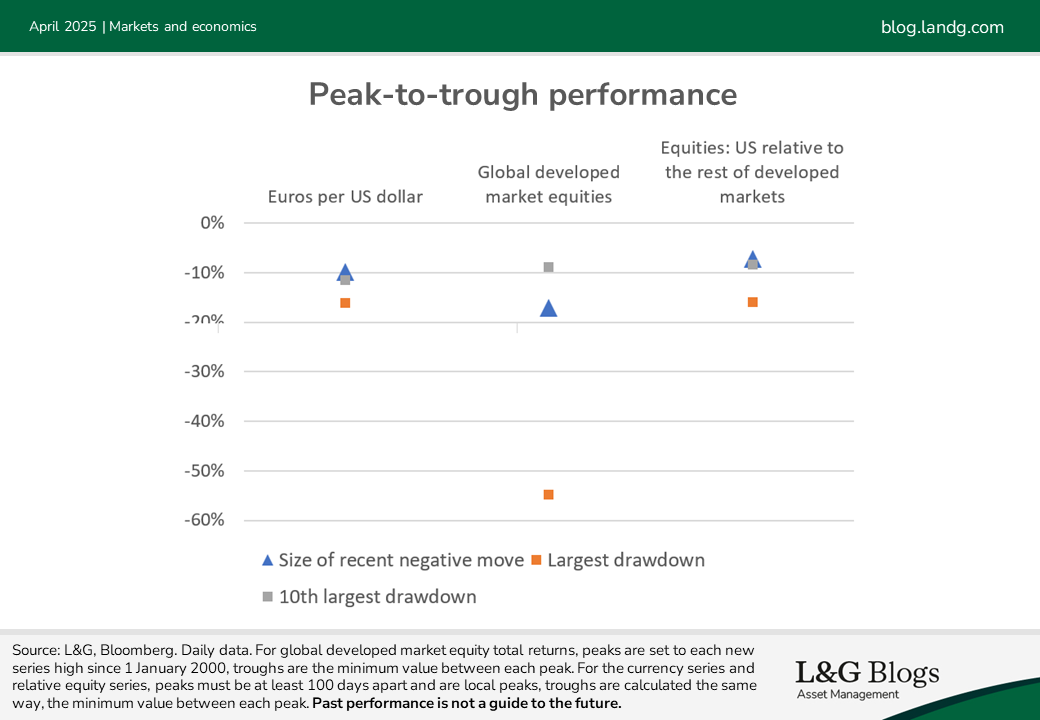
This illustrates that the negative performance in equities, the US dollar and relative US regional equities is very significant. However, so far markets see the repricing as being consistent with bad historical outcomes, but not the most extreme witnessed.
Of course, the current episode still to play out fully. The eventual peak-to-trough move therefore may be larger than seen so far. Over longer time horizons, trend movements in currencies can be much larger too. For example, from its peak in 2001 the US dollar almost halved in value against the euro to its trough in 20083.
But equally, our illustration demonstrates three asset classes where we know the current move has been substantial. This is a form of selection bias and so can make any event sound more extreme. For example, the peak-to-trough move in 10-year UK government bond yields was only about 0.5%[3] and comparatively low for similar-sized past equity shocks since 2000.
What will be in 2025’s history books?
For long-term investors, such as DC members, most of the focus is on strategic asset allocation and how best to construct funds so they aren’t excessively exposed to one possible outcome.
The current market volatility may not be over, and while the narrative around trade policies is negative and realistic, it's essential to recognise that there are lots of other outcomes that could happen. For example, the International Monetary Fund (IMF) found that from 1992 to 2014 the consensus economic forecast only predicted 10% of recessions one year in advance.[4]
So, what might help cause one of the more positive potential outcomes?
Well, we’ve already seen the US administration adjust its trade stance several times, both negatively and positively for markets. In addition, President Trump’s campaign promises included lowering taxes and deregulation, both of which could potentially be supportive for equity markets. Then of course we need to allow for potential policy reaction from other sources, for example other countries could boost fiscal spending, as Germany and South Korea have already pledged to do.
From a long-term strategic basis, diversification can go a long way towards limiting exposure to a single asset class, region or currency. Market cap global equities have about 65% US exposure[5], and unless currency hedged then a similar level of US dollar exposure.
The last decade has shown how differently the US can perform relative to the rest of the world, but this level of exposure is a risk concentration that may not be rewarded. Including other assets, like global real estate and infrastructure, may also help further diversify the risk.
Major financial events, like the 2008 recession, dot-com bubble and the COVID-19 pandemic, serve as historical lessons. From an investor perspective, it’s important to understand market cycles, in order to stay disciplined during downturns and remain focused on the long term.
History has shown us that those who stayed invested in diversified assets, despite temporary declines, can potentially benefit from compounding growth over decades.
We think that by avoiding too much focus on short-term noise, investors can navigate the complexities of current market conditions more effectively.
Interested in reading more about DC pensions and investments? You can find our latest content on our designated DC blog page.
[1] As at 14 April 2025
[2] Source: Bloomberg
[3] Source: Bloomberg
[4] How Well Do Economists Forecast Recessions?
[5] Source: MSCI ACWI Index, 64.55% as at end March 2025
Key risks
It should be noted that diversification is no guarantee against a loss in a declining market.
Past performance is not a guide to the future. The value of an investment and any income taken from it is not guaranteed and can go down as well as up, and the investor may get back less than the original amount invested.
Assumptions, opinions and estimates are provided for illustrative purposes only. There is no guarantee that any forecasts made will come to pass.


Recommended content for you
Learn more about our business
We are one of the world's largest asset managers, with capabilities across asset classes to meet our clients' objectives and a longstanding commitment to responsible investing.
