Disclaimer: Views in this blog do not promote, and are not directly connected to any L&G product or service. Views are from a range of L&G investment professionals, may be specific to an author’s particular investment region or desk, and do not necessarily reflect the views of L&G. For investment professionals only.
Solutions chart update: S&P500 in 2025. Treble 20?
With US equities delivering returns of over 20% in each of 2023 and 2024, how could DB schemes still seeking growth position portfolios this year?

“...you've got to ask yourself one question: 'Do I feel lucky?' Well, do you, punk?"
The year when Dirty Harry uttered these famous words – 1971 – wasn’t a year where there had been consecutive 20%+ S&P500 returns. Nonetheless, it seems to be an apt quote when weighing up US equity potential in 2025 returns given their strong performance in both of the past two years.
By our calculations, 20%+ price returns took place in 1935/36, 1954/55, 1975/76*, 1995/96 and now of course 2024/25. (*returns were actually just under 20% in 1976 but we’ve kept in after rounding.)
What happened next?
The following chart which highlights the two years of price returns in each of these periods followed by the subsequent two years. All data is rebased to 100 at the start of the period. (For example, taking using as an example 31/12/2024, 0 days represents 31/12/2024 while -720 days is broadly two years earlier: the end of 2022)
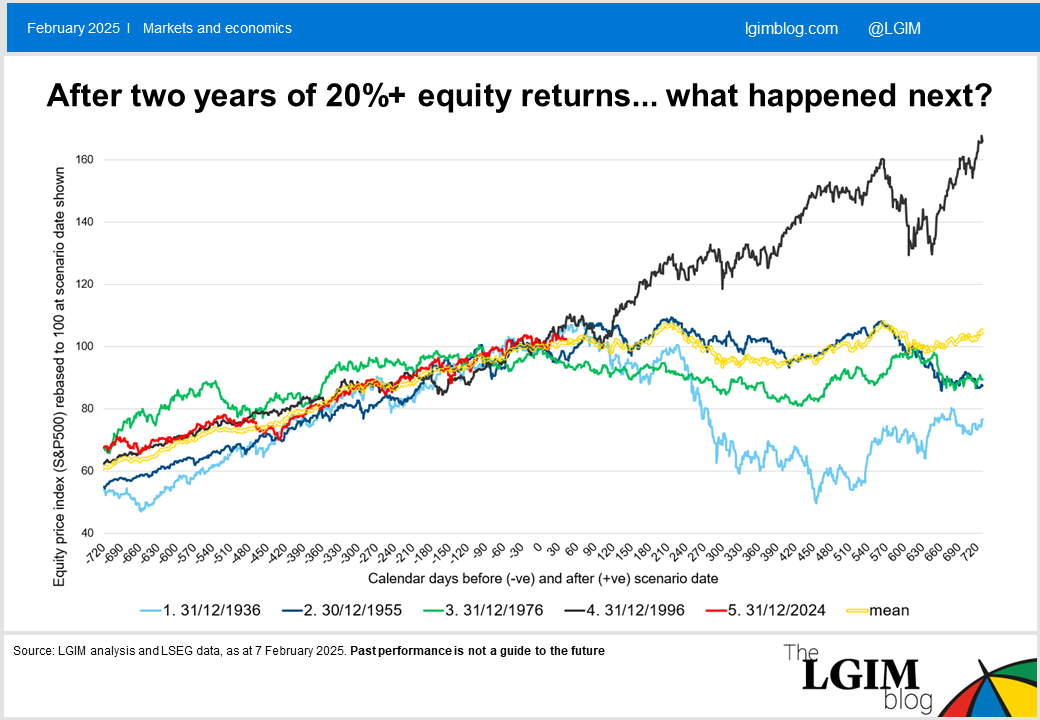
In summary for the two years which followed:
- 1935/36 saw a full blown US equity crash
- 1954/55 equities ‘muddled through’ but it wasn’t great
- 1975/76 witnessed a correction but not a crash
- 1995/96 saw a big bull run, which ran for another three years until the dotcom crash in 2000
Investopedia has nice summary of the economics of some of those periods.
And for 2025?
Starting with some numbers:
- January has of course happened! The S&P was up c.3%.
- By our calculations from historical data, the S&P500 has been up at the end of the year 80% of the time after a positive January, with an average 13% price return for the year (since 1928)
- On the other hand, in 1937 the return in January was also c.3%...before capitulating to a -37% return for the year
- In 1956 and 1977 returns in January were negative.
It’s important to note that past performance is not a reliable guide to the future. But to give one a feel for potential outcomes, we can note from looking at prior periods in this (admittedly limited) sample, equity markets have been tripped up by either growth fears/recession or inflation (sound familiar?).
The really bad stuff has generally been recession and deflation (which characterised the 1937/38 period). For those hoping for a repeat of the late 90s, we caution that this required all the investment stars to be aligned.
Inflation was stable and low, and while US Federal Reserve policy did actually tighten very slightly in 1997, it loosened in 1998 in response to the Long-Term Capital Management Asian financial crises, and – notably – bond yields fell.
Closing thoughts
The 1937/38 period is a reminder of the importance of compounding. 1937 at -39% was followed by a healthy 25% bounce back in 1938. This sounds just about manageable i.e. a -14% drawdown arithmetically. However, the reality is that this compounds to -24%!! (0.61 * 1.25).
In this vein, we see potential value in looking to equity option strategies to seek to mitigate the effects of smaller drops in equity indices, not least given the relatively sanguine outlook for the US, combined with the relatively low cost of insuring that risk (i.e. levels of implied equity volatility remain on the lower side versus history).
In contrast, it also wouldn’t be particularly surprising if equity markets bounced sideways this year or indeed moved sharply higher again.
If you’ve enjoyed this content, we’d like to highlight that you can find all our latest content for DB schemes in one place at our designated DB blog page.
All data is from LSEG, as at 7 February 2025. Past performance is not a guide to the future.

Recommended content for you
Learn more about our business
We are one of the world's largest asset managers, with capabilities across asset classes to meet our clients' objectives and a longstanding commitment to responsible investing.
