Disclaimer: Views in this blog do not promote, and are not directly connected to any L&G product or service. Views are from a range of L&G investment professionals, may be specific to an author’s particular investment region or desk, and do not necessarily reflect the views of L&G. For investment professionals only.
Chart of the month: Earnings or hype?
This month, we assess what’s driving the performance of large-cap US tech companies.
In addition to geopolitics and precious metal prices, one of the key themes currently at the forefront of investors’ minds is whether technology stocks (and AI-linked companies in particular) are in a bubble.
On this theme, the Nasdaq 100 index has been lagging US and global equity market over the past few months. This, in turn, is triggering these latent concerns about the potential overvaluation of that sector of the overall market.
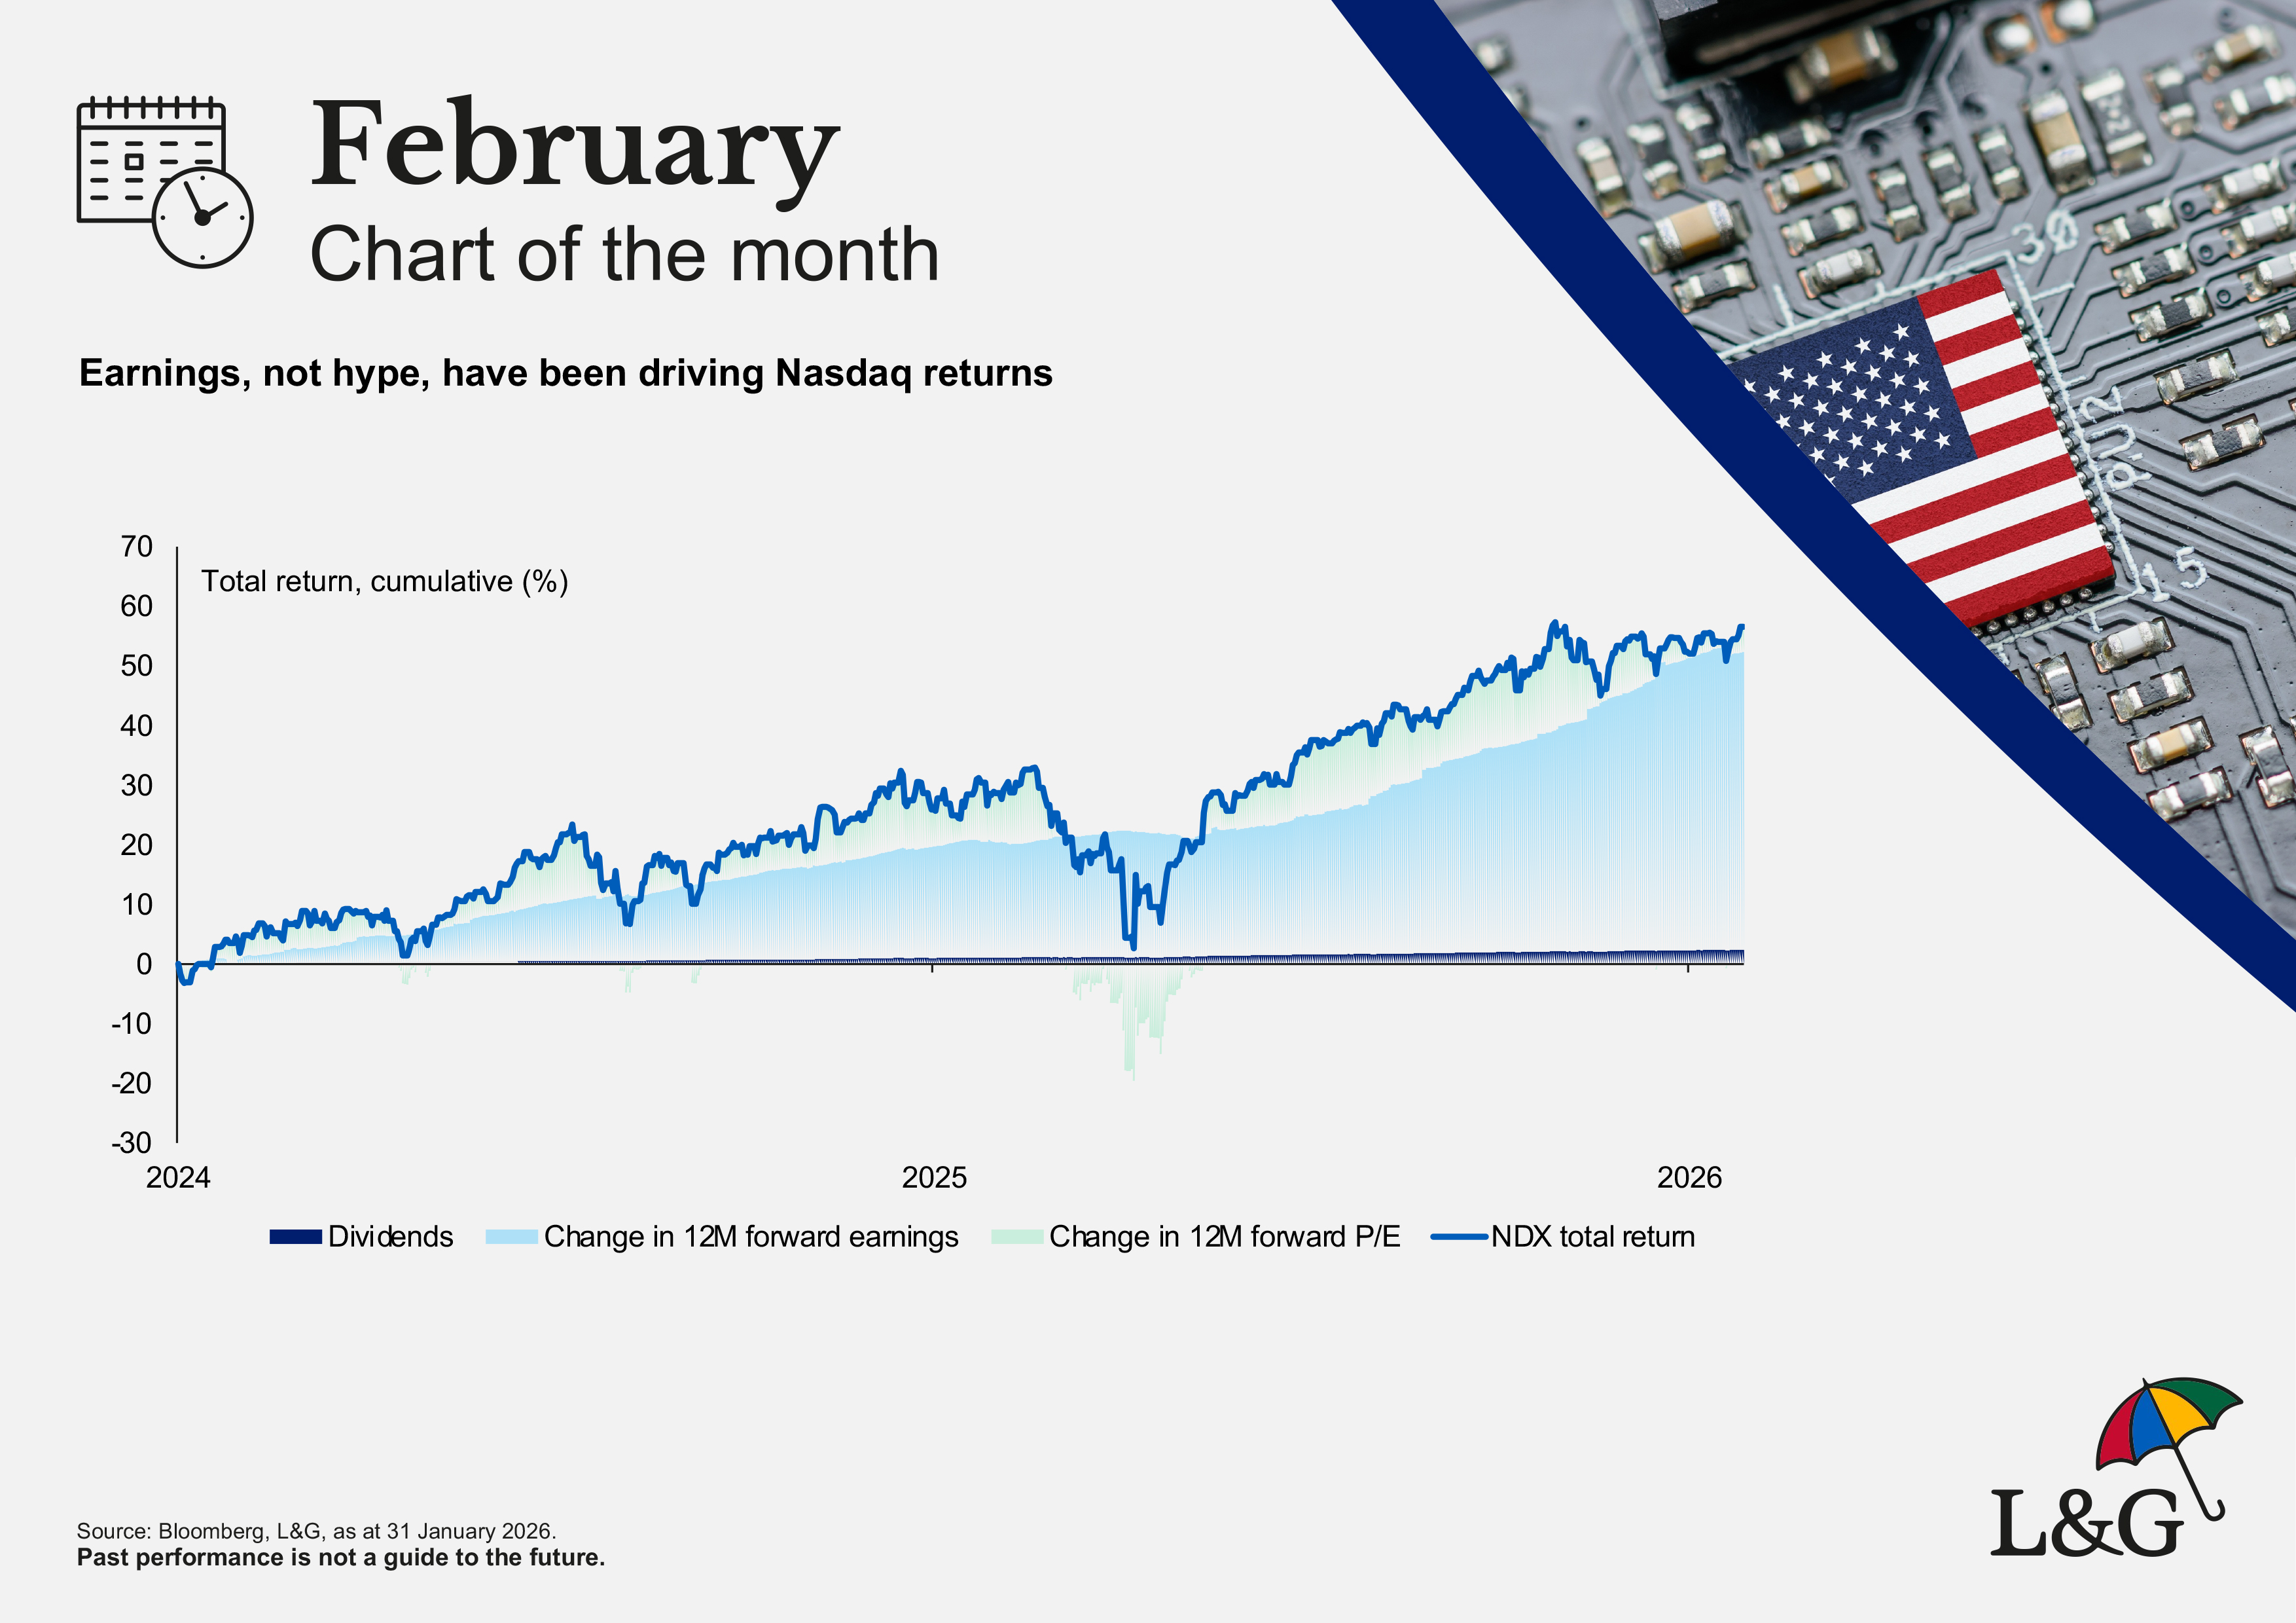
While price-to-earnings multiples across the index are indeed high relative to history, our chart of the month highlights how it is actually earnings delivery – not hype – that has delivered returns to investors over the past two years.
The chart breaks down returns into contributions from dividends (negligible given a dividend yield of less than 1%), multiple expansion (an increase in the valuation investors are prepared to pay for those companies i.e. an increase in hope or hype) and earnings (i.e. company delivery).
While clearly this could change in the future (the past is no guide to future performance), we note that it is a very different backdrop to the 1999/2000 dot.com bubble period when hype, not earnings, was driving returns.

Recommended content for you
Learn more about our business
We are one of the world's largest asset managers, with capabilities across asset classes to meet our clients' objectives and a longstanding commitment to responsible investing.
