Disclaimer: Views in this blog do not promote, and are not directly connected to any L&G product or service. Views are from a range of L&G investment professionals, may be specific to an author’s particular investment region or desk, and do not necessarily reflect the views of L&G. For investment professionals only.
A fresh perspective on EM: advanced economies hiding in plain sight
Who’s richer: Japan or China? The answer reveals why GDP per capita doesn’t tell the whole story.

In macroeconomics and macro investing, we tend to gauge a country’s level of development by a single number, its GDP per capita. This number enters rating models, growth models, even long-term currency models.
While useful in some contexts, we lose nuance by attempting to capture the level of development with a single number.
Take the example of the US and the Netherlands. In 2024, the GDP per capita of the US was 27% higher than that of the Netherlands – both measured in current US dollars.[1] However, that is due to a small group of people in the US with very high incomes. The median US income, that is the income of your average Joe with half of the population earning more and half earning less, is 15% below that of the Netherlands.[2] Which country is richer?
In EMs, we lose even more nuance, because the income distribution tends to be more uneven than in advanced economies – even when looking at pre-tax and pre-transfer incomes, as we do. This is due to two factors.
First, as economies develop and people start to move from the low-productivity rural sector to the high-productivity urban sector, inequality rises. Once most people have arrived in the high-productivity sector, inequality start to fall again. EMs usually sit close to the peak of this so-called Kuznets curve.
Second, richer countries have a greater preference for economic security over growth than poorer countries, which is reflected in their institutions (e.g. labour rights) and flatter income distributions even before taxes and transfers.
Do adjust your set
Distributional data can provide an entirely new perspective on EMs. They may have lower GDPs per capita than advanced economies, but they also have large pockets of richness. As a result, many EMs can be thought of as advanced economies with an appendage of low-cost workers.
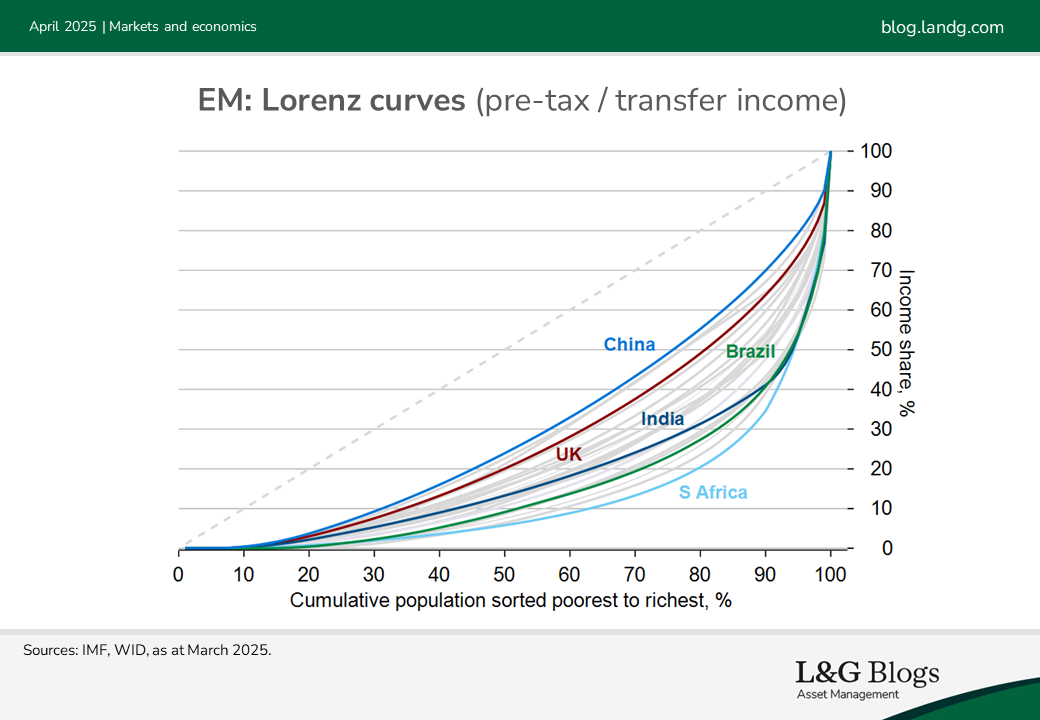
The below shows the income distributions of the top 23 EMs and the UK. It shows the cumulative percentage of the population, sorted from poorest to richest on the X-axis and the income share held by the corresponding population share on the Y-axis. The broken line represents an equal income distribution and the more a curve bends towards the lower right corner, the more uneven the income distribution is.
A few points stand out. Most EMs display greater income inequality than the UK. Income inequality is lower in formerly communist countries, with China the most extreme example. Asia displays lower income inequality than Latin America, mostly due to past land reforms. South Africa remains the most unequal society in our sample, 30 years after Apartheid.
The below shows China’s GDP per capita, but instead of giving one number for the entire country, the blue line shows the average GDP per capita for increments of 14 million people (1% of the population) ordered from richest to poorest.
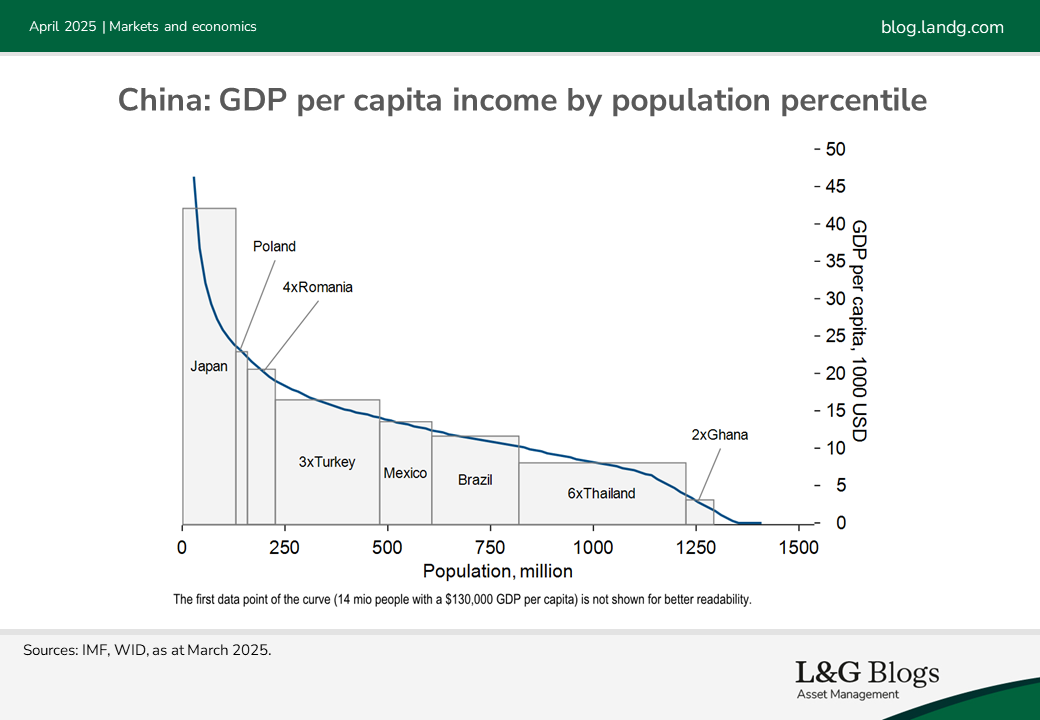
In China, the richest 14 million – about the population of Belgium – have an average income of $130,000. For comparison, the UK’s GDP per capita is $53,000. The richest 126 million Chinese – about the population of Japan – have an average income comparable to Japan. In terms of living standards, China can be thought of as a combination of countries comprising Japan, Poland, four Romanias, three Turkeys and so on. Hence, saying that Japan is richer than China misses the point. China includes an entire Japan plus some more.
In the same vein, Poland can be thought of as a country comprising Sweden, Hungary, Bulgaria and Azerbaijan. Similarly, Korea is a combination of Switzerland, two New Zealands, Portugal, Hungary, Serbia and Kyrgyzstan.
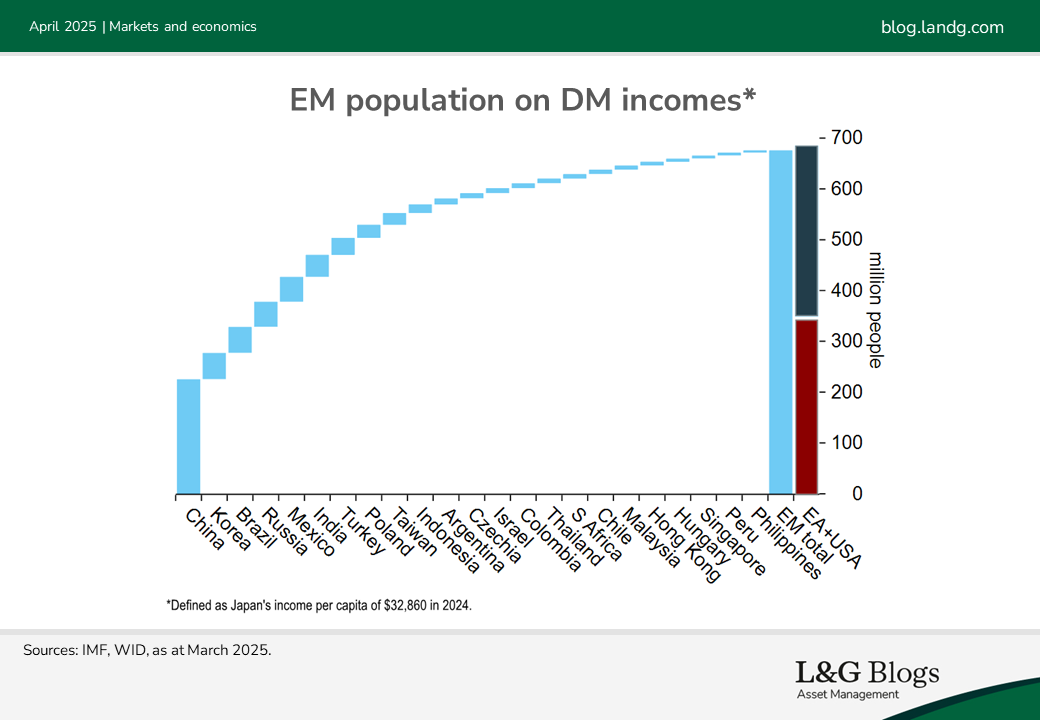
How many people in EMs draw advanced economy incomes, defined as Japan’s GDP per capita? Close to 700 million, or equivalent to the combined populations of the US and euro Area. China accounts for only a third of those affluent EM citizens.
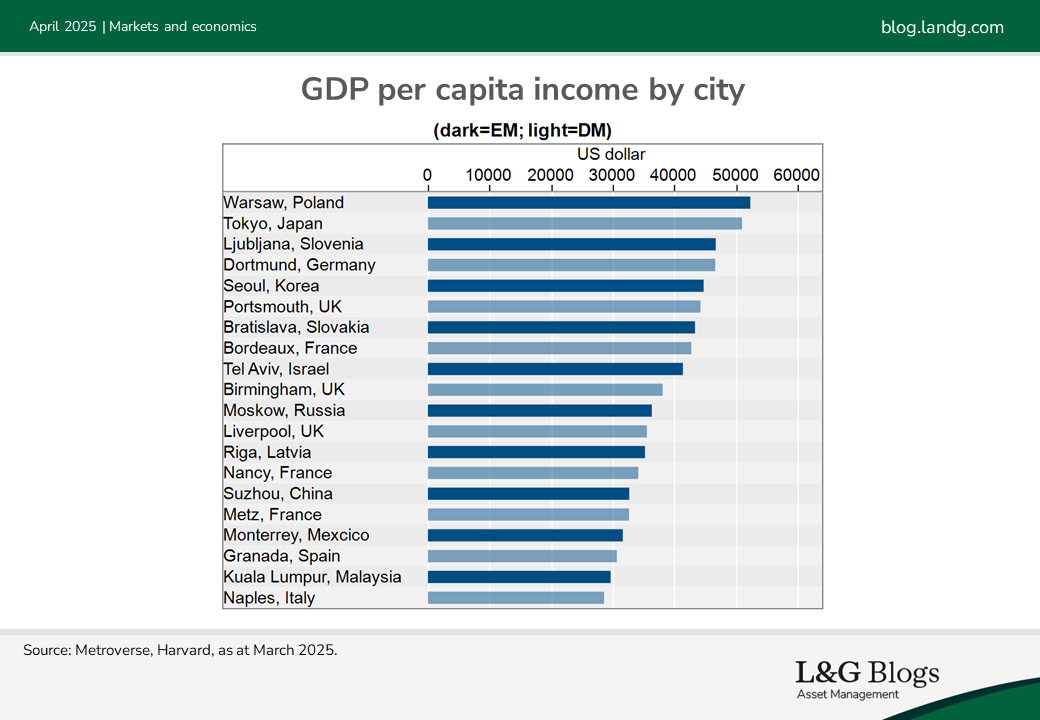
A final way to illustrate the affluence present in EMs is to compare the incomes of their cities with those of developed market cities. Cities, after all, are where richness is concentrated. It turns out that Warsaw is richer than Tokyo, Seoul richer than Portsmouth and Moskow richer than Nancy.
Why does it matter for investors?
Some systems are only as strong as their weakest link. Think of supply chains or network security. However, some systems are as strong as their strongest members, for example sports teams with a star player or a population saved by a single genetic mutation.
For development, cities or regions that are more productive than the rest of the country matter as they can grow and cross-fertilise. As India has shown, a country doesn’t need 1 billion highly productive people to fly to the moon; a few million will do.
Pockets of excellence also matter for macro investors. Does the quality of a country’s institutions and, therefore, its risk profile depend on its average income or a critical number of skilled stakeholders and civil servants? Our conjecture is the latter. This would explain why the quality of monetary policy in the top EMs is similar to advanced economy levels.[3]
Next time you think of EMs, think of advanced economies with large pools of low-cost workers.
[1] Source: IMF, World Economic Outlook.
[2] Source: IMF, World Economic Outlook; World Inequality Database.
[3] Source: Fraser Institute.

Recommended content for you
Learn more about our business
We are one of the world's largest asset managers, with capabilities across asset classes to meet our clients' objectives and a longstanding commitment to responsible investing.
