Disclaimer: Views in this blog do not promote, and are not directly connected to any L&G product or service. Views are from a range of L&G investment professionals, may be specific to an author’s particular investment region or desk, and do not necessarily reflect the views of L&G. For investment professionals only.
Chart of the month: what we talk about when we talk about inflation
Continued tightness in the labour market has led to sticky inflation in less scalable parts of the services sector.
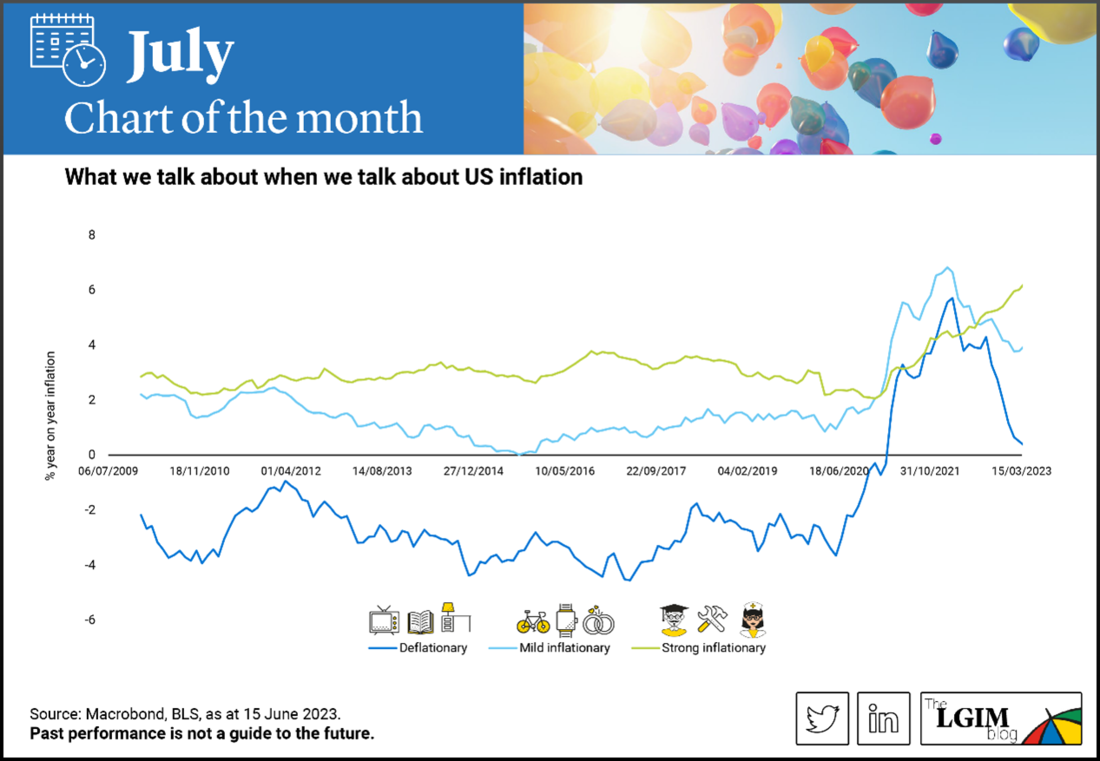
US inflation is off its peak, but is easing at a slower pace than the Federal Reserve (Fed) had been expecting. In our latest Chart of the Month, we take out the magnifying glass and break inflation down into 132 sub-components, and then regroup them into three categories aligned to their pre-pandemic inflationary trends.
What we find is that components that were getting cheaper pre-pandemic, such as mass-produced homewares, books and basic electronics, are likely to soon resume a deflationary trend. That makes sense as the disruption to production and supply chains from COVID is now behind is.
Mild inflation components, including some luxury goods and scalable service sector areas, also bounced higher in the pandemic but again are showing some deceleration in the rate of inflation.
But it’s the less scalable service sectors with already strong inflation trends pre-pandemic that are the most worrying today: healthcare, education, maintenance, eating out. There is no easing of inflation here, with it still rising at over 6% year-on-year, on average.
If that persists, the Fed will feel the pressure to continue rate hikes. We believe that a recession is still ahead of us and could be a necessary release valve for the tight labour market that is driving inflation in these components higher.

Recommended content for you
Learn more about our business
We are one of the world's largest asset managers, with capabilities across asset classes to meet our clients' objectives and a longstanding commitment to responsible investing.
