Disclaimer: Views in this blog do not promote, and are not directly connected to any L&G product or service. Views are from a range of L&G investment professionals, may be specific to an author’s particular investment region or desk, and do not necessarily reflect the views of L&G. For investment professionals only.
Boom or bust?
We offer an outside view on the AI bubble debate.

The number one debate in the world of finance today is some version of the question: “Is AI a bubble that is set to burst?”
AI-optimists point to the potential for revolutionary technological change and the robust growth of earnings in the largest tech names. AI-pessimists point to high valuations and the increasing cash needs to finance capital expenditure.
I don’t want to do either of those things. Instead, let’s take inspiration from Danel Kahneman’s 2011 book Thinking Fast and Slow to help think about this problem differently. In that book, he extols the virtue of taking an ‘outside view’ when considering a forecasting problem. An ‘outside view’ is a forecasting approach that involves looking at the experience of similar historical situations to predict an outcome, rather than focusing on the specific details of the current episode.
This is implicit in how some people talk about the current market outlook, but it is typically not very structured and tends to focus on the most dramatic boom/bust cycles: “Today’s tech stocks are like the dot.com stocks of the late 1990s” or “Today’s tech stocks are like the Nifty Fifty of the early 1970s”.
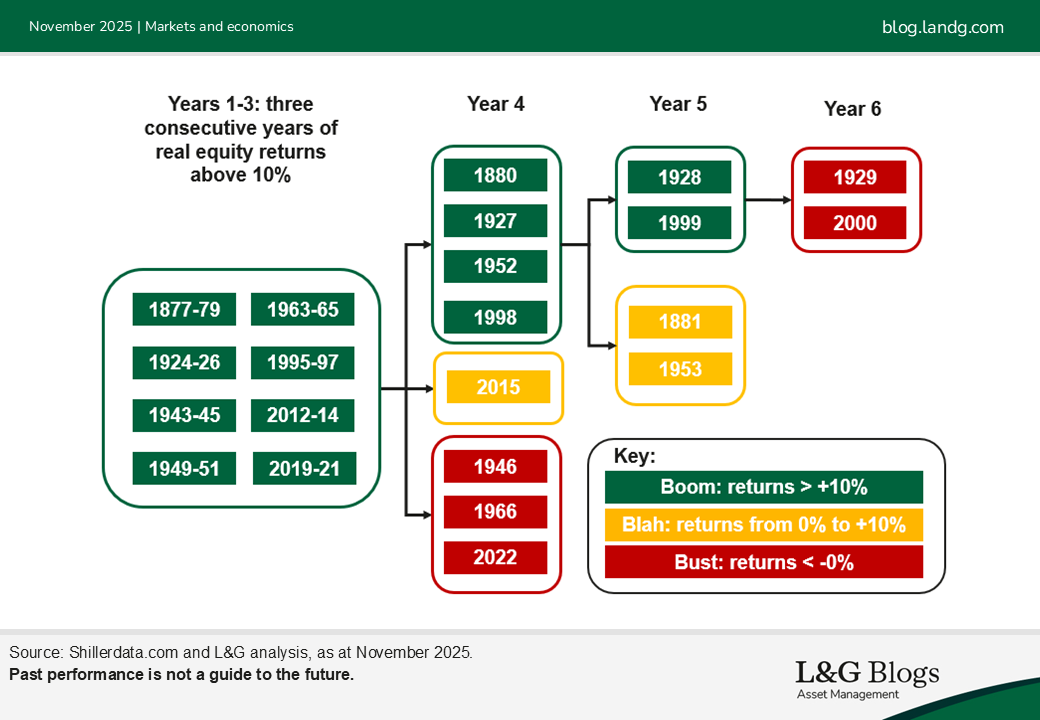
What might a more structured approach look like? Let’s start by thinking about the entire equity market. It’s clearly possible that the wheels will come off in the last few weeks of the year but, after a nasty drawdown in 2022, it looks like we’re seeing the third consecutive year of double-digit real equity returns in 2025. How often have we seen that in the past and what has it said about the future?
Using the Robert Shiller data,[1] which runs from 1871, there have been eight previous episodes when equities went on a run of real returns above 10% for at least three consecutive years. What happened next?
Based on this small sample, we can say that an ongoing boom has been (marginally) more likely than a bust (defined as -10% or weaker in real returns). in year 4. In half of those episodes, the boom kept running for a 4th year. In two, it kept running for a 5th year. In the two booms which ran for five years, the bubbles inflated further before ending with two of the biggest busts of the last century. The potential implications of this is that even if we have correctly identified a bubble today, it could still be another painful two years trying to go short in anticipation of a bust.
However, we can say that as well as boom risk, bust risk is elevated. Across the whole sample, there are 24 bust years implying a chance of around 15%.
But that’s still a small sample on which to base our outside view. Can we do any better? How about taking all the sector level data we can find, for as long as we can find it, and looking systematically for comparable episodes?
The Fama-French database[2] has 99 years of data across 48 US equity market sectors. We can look across that historical record for sectors with statistics like today’s tech stocks. My focus here is simply on trailing returns. In the three years through to the end of September 2025, the so-called Magnificent Seven[3] stocks delivered a cumulative return of 250%. Across all sectors, we’ve seen a development like that 53 times in the last 99 years.
Again, what happened next?
Volatility at the sector level is higher than for the whole markets (see Diversification 101!)[4]. So, this time I’m looking for “proper” busts where the drawdown from the point of investment is at least 40%.
If you had invested in a random equity sector at a random point in time, you had a one-in-ten chance of suffering a drawdown of at least 40% on your initial investment over the subsequent two years. That’s the “unconditional probability” line in the chart below.
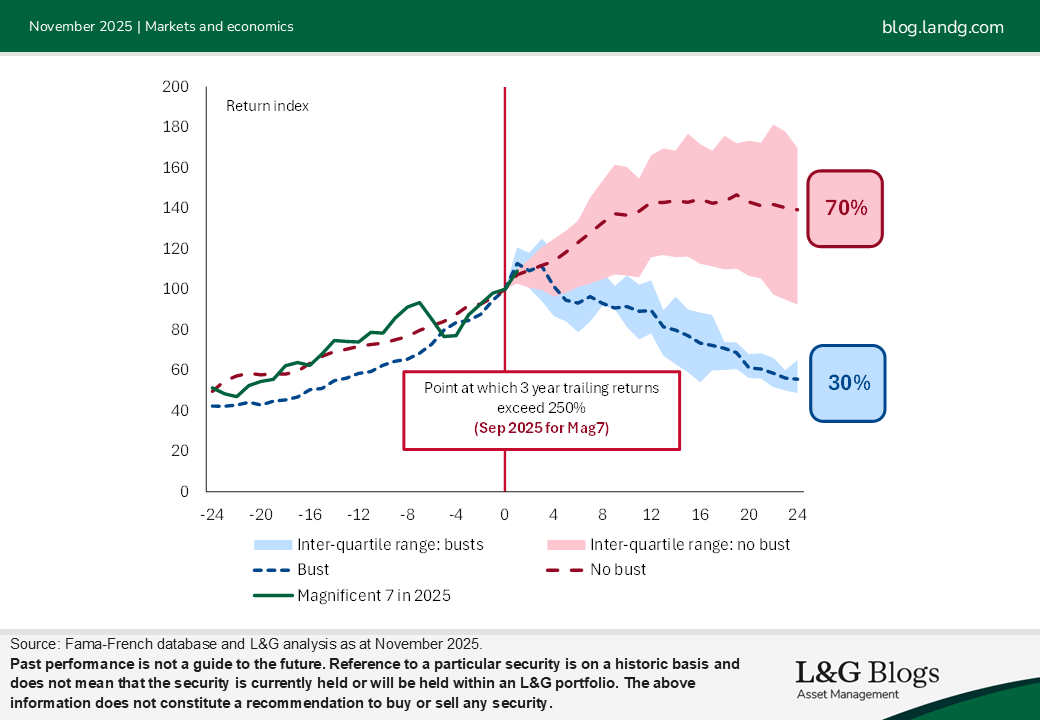
We can then condition the drawdown probability on the returns over the last three years. That is the series of blue bars. When returns have been as strong as those of the Magnificent Seven, potential crash risk rises to around one-in-three.
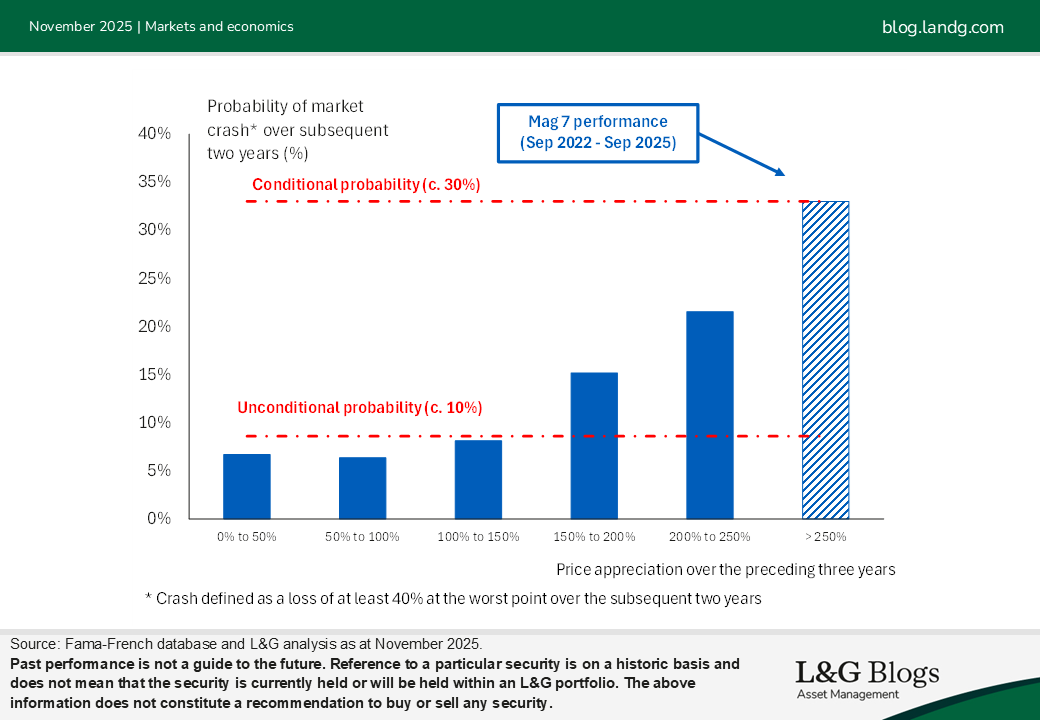
Bust risk has been higher after strong sector returns. But, perhaps surprisingly, so has boom risk.
In the non-bust scenarios (seen roughly two-in-three times), sector returns have averaged +40% over two years historically. Booms like the one have witnessed from the Magnificent 7 in the last three years have not tended to “go gentle into that good night”. They have either gone pop, or carried on the same trajectory for a few more quarters.
The outside view can’t bring a definitive answer to the AI bubble debate. After all, the past is no guide to future performance. But, the historical record can hopefully provide a framework for thinking about the risks.
Rather than saying ‘boom’ or ’bust’, the data at both the market and sector levels point in the same direction. Crash risk is elevated but still potentially less likely than ongoing outsized positive returns.
Past performance is not a guide to the future. Assumptions, opinions, and estimates are provided for illustrative purposes only. There is no guarantee that any forecasts made will come to pass.
[1] https://shillerdata.com/
[2] https://mba.tuck.dartmouth.edu/pages/faculty/ken.french/data_library.html
[3] Meta, Amazon, Apple, Microsoft, Alphabet, Nvidia and Tesla. The phrase “Magnificent 7” was first used to refer to this group of companies in 2023. For illustrative purposes only. Reference to a particular security is on a historic basis and does not mean that the security is currently held or will be held within an L&G portfolio. The above information does not constitute a recommendation to buy or sell any security.
[4] It should be noted that diversification is no guarantee against a loss in a declining market.

Recommended content for you
Learn more about our business
We are one of the world's largest asset managers, with capabilities across asset classes to meet our clients' objectives and a longstanding commitment to responsible investing.
