Disclaimer: Views in this blog do not promote, and are not directly connected to any L&G product or service. Views are from a range of L&G investment professionals, may be specific to an author’s particular investment region or desk, and do not necessarily reflect the views of L&G. For investment professionals only.
All quarters are equal, but some are more equal than others
What do Nobel Prize-winning physicist Niels Bohr and baseball player Yogi Berra have in common? They’ve both been cited as the source of one of my favourite market-relevant quotes: "prediction is very difficult, especially if it’s about the future".

One of my investment bugbears is dressing up statements about the past as statements about the future. Forecasters are fond of pulling off this trick to make themselves seem profound.
Anyone with a passing acquaintance with macroeconomics can tell you that GDP is a ‘flow’ rather than a ‘stock’ concept. It captures total economic output within a given period, rather than the level at the end of that period. The same principle applies to corporate earnings: profits accrue, rather than being measured as a snapshot at one point in time.
However, forecasts and commentators sometimes fixate on annual growth rates. My problem with these calendar-year growth ‘forecasts’ is that they often tell us about the past rather than the future.
An excellent little paper from Statistics Canada offers a peak behind the curtain. The chart below is adapted from one of theirs. It shows how much each quarterly growth rate figure contributes to the calculation of the annual average.
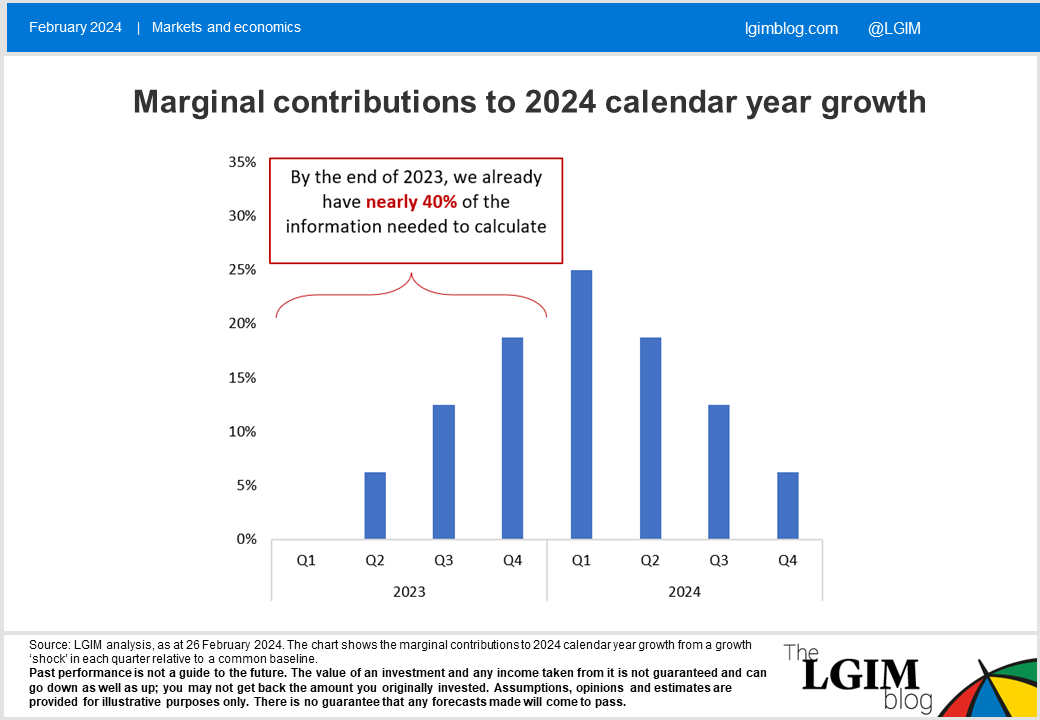
In utterly counterintuitive fashion, the chart demonstrates that the third quarter of 2023 could be a more important determinant of 2024 growth than the fourth quarter of 2024. This highlights the substantial look-ahead bias inherent in any calendar-year forecasting.
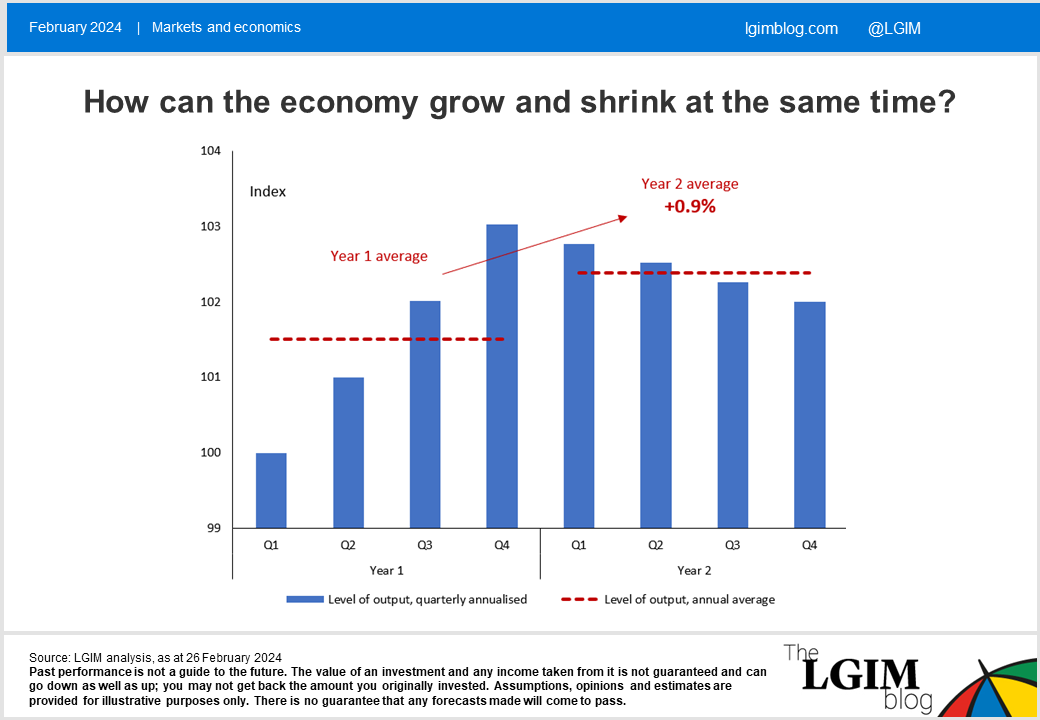
Let’s run with an example here. Suppose that growth in every quarter of one year is +1%, but then a recession begins at the start of the next year, with output contracting by 0.25% in every subsequent quarter.
Output in this hypothetical economy has fallen by 1% during year two, but still expanded by 0.9% when measured on an annual average basis. This is a purposefully extreme example, but highlight the problem that calendar year ‘forecasts’ can often tell us more about the past than the future.
It doesn’t have to be this way. The Federal Reserve assiduously reports its expectations on a Q4-on-Q4 basis to avoid this bias. That best practice, sadly, does not extend to many other institutions. It’s not clear to me why any asset price should care about events that happened several quarters ago.
As George Orwell might have said[1], believing in the special power of calendar year forecasts is to believe that “all quarters are equal, but some are more equal than others”.
[1] If he were around today and interested in calendar-year averaging, rather than, in my opinion, being one of the greatest British novelists of the 20th century!

Recommended content for you
Learn more about our business
We are one of the world's largest asset managers, with capabilities across asset classes to meet our clients' objectives and a longstanding commitment to responsible investing.