Disclaimer: Views in this blog do not promote, and are not directly connected to any L&G product or service. Views are from a range of L&G investment professionals, may be specific to an author’s particular investment region or desk, and do not necessarily reflect the views of L&G. For investment professionals only.
The low-volatility factor: Not-so-standard deviation
In the second instalment of a new series on factor investing, we consider how the risk of a stock can be defined and explain why downside volatility could provide a better assessment than standard deviation.

In the first part of this blog series, we described why the low-volatility anomaly exists, focusing on behavioural biases and the limits of arbitrage in the real world.
But we haven’t yet addressed an important point: how do we define and quantify the ‘risk’ of a stock?
The most common measure here is the standard deviation (or volatility) of a stock. When using plain volatility, one considers both negative and positive deviations from the mean returns equally. A rational investor, however, wouldn’t ordinarily consider deviations to the upside as risk, but instead as potential.
Factor investing aiming to exploit the low-risk effect using a low-volatility strategy inherently limits this upside due to the nature of how standard deviation is being calculated. We therefore believe that downside volatility is a better measure of risk for two important reasons:
1. A focus on negative returns
Standard deviation as a measure of risk punishes both positive and negative returns. Consider the following example:
Suppose you had two stocks with the following set of returns (%)[1]:
- A = -10, -9, -8
- B = 2, 10, 3
Using standard deviation, the respective volatilities are 0% and 4%. Hence, stock A is considered less risky by the classic standard deviation. The downside volatility, however, would suggest, in our view, that stock B is less risky.
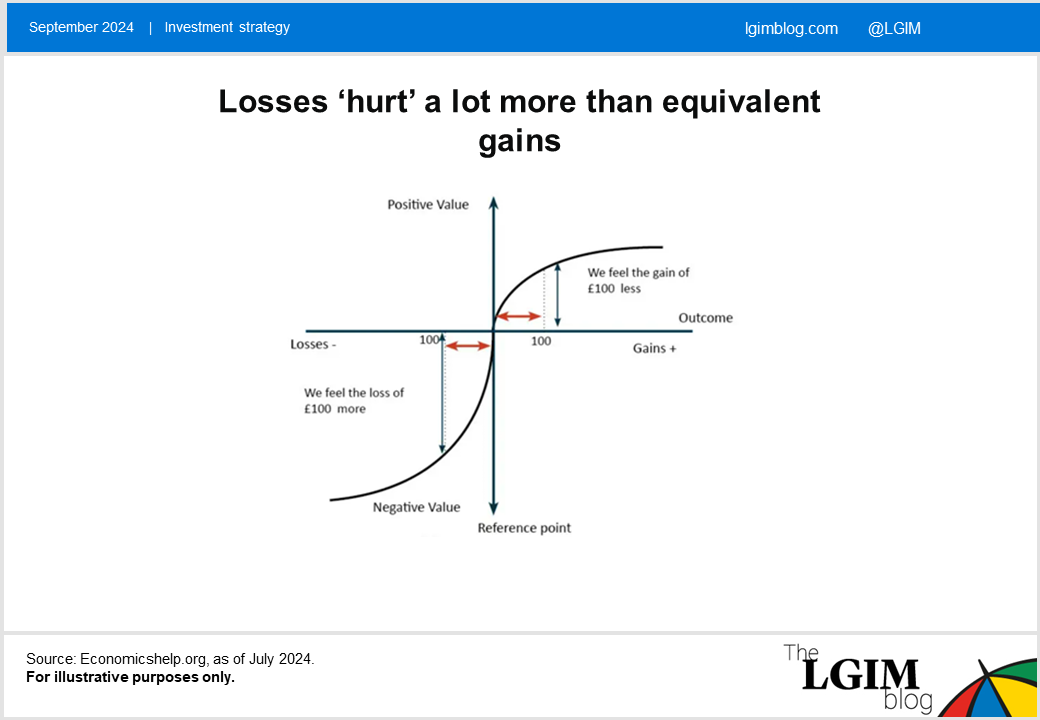
2. Loss aversion bias
From the perspective of investors, losses have more psychological impact than gains.[2] Losses ‘hurt’ a lot more than the ‘joy’ provided by equivalent gains, as shown below. Thus, we believe downside volatility aligns more closely to an investor’s perception of risk.
Having explained the reasons for the existence of the low-volatility anomaly and reasons why we believe downside volatility is a better measure of risk, in the next instalment we aim to empirically answer the following questions:
- Does the low downside volatility premium exist?
- Do low downside volatility strategies provide risk mitigation?
- What could explain the recent underperformance of low-volatility strategies?
- Do we think the low downside volatility premium is likely to persist going forward?
Key risks:
Past performance is not a guide to the future.
[1] For illustrative purposes only. This information does not constitute a recommendation to buy or sell any security.
[2] Kahneman, Daniel, A. Tversky. “Prospect Theory: An Analysis of Decision Under Risk.” Econometrica
47 (1979), pp. 263-291.

Recommended content for you
Learn more about our business
We are one of the world's largest asset managers, with capabilities across asset classes to meet our clients' objectives and a longstanding commitment to responsible investing.
