Disclaimer: Views in this blog do not promote, and are not directly connected to any L&G product or service. Views are from a range of L&G investment professionals, may be specific to an author’s particular investment region or desk, and do not necessarily reflect the views of L&G. For investment professionals only.
Small but perfectly formed?
Small-cap US equity indices can offer more balanced sector coverage than tech-dominated large-cap indices, and adding a quality tilt could help improve resiliency in the universe.

Is bigger always better? For investors seeking diversified exposure to the US equity market, perhaps not.
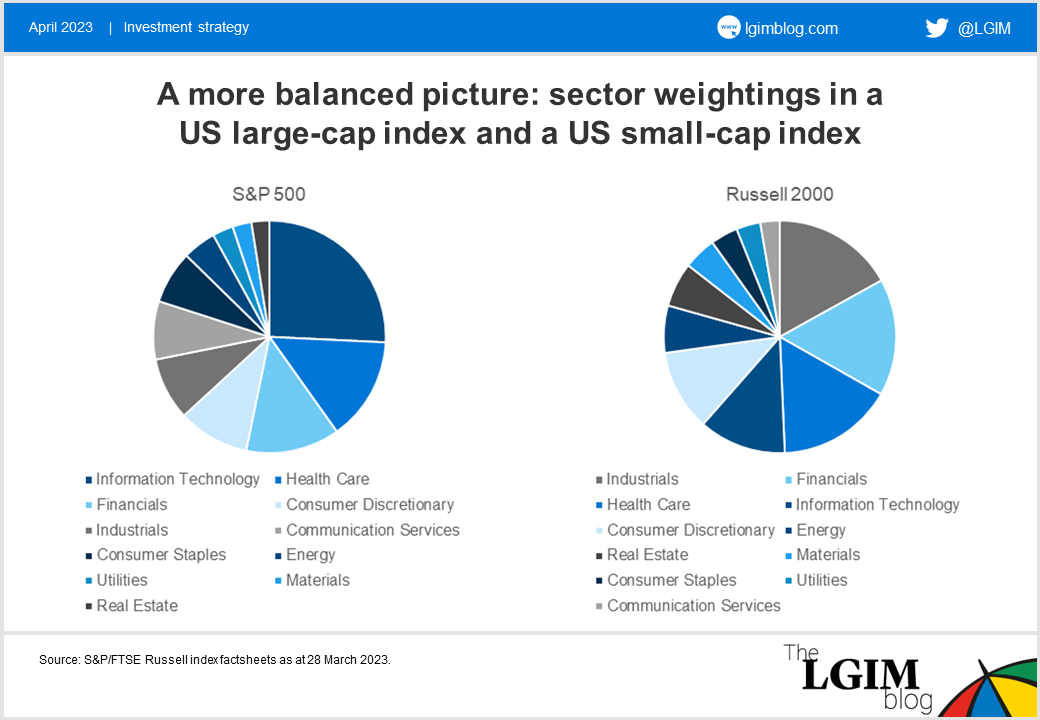
The three biggest constituents of the S&P 500 are Apple*, Microsoft* and Amazon*, and at a sector level the dominance of technology in the large-cap index is clear to see, with more than a quarter of the index in technology names.[1]
By contrast, US small-caps indices currently offer more balance.** For example, in the Russell 2000 index, financials, health care, industrials, technology and consumer discretionary each represent between 10% and 18% of the index weight.[2]
In-sector diversification and US focus
There are also differences within each sector between small- and large-cap indices. For example, large-cap energy stocks are mainly large multinational oil companies, while the energy stocks found in small-cap indices are more specialised and local, and derive most of their revenues domestically.
The same applies to other sectors.
The domestic exposure of the Russell 2000 is greater than the S&P 500’s, being almost 10% higher.
Relative value
Having established why investors may look to include exposure to small caps on diversification** and geographical grounds, let’s consider valuations.
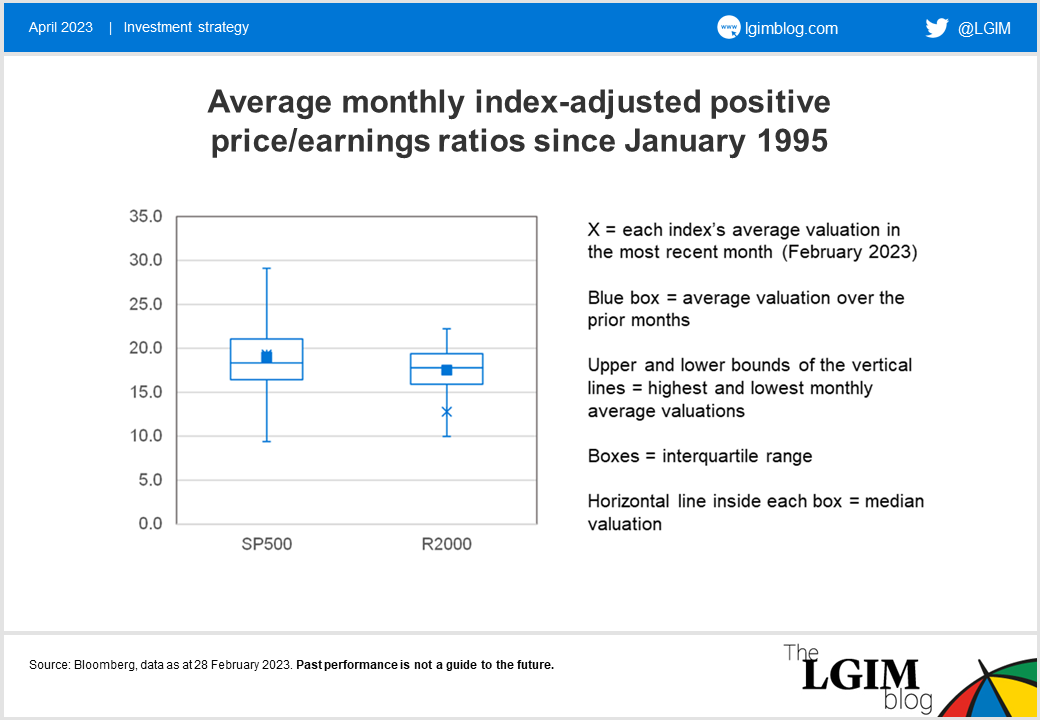
The chart below shows average monthly index adjusted positive price-to-earnings (P/E) ratios since January 1995, with the cross representing current valuations. Approximately 24% of the US small-cap universe by market cap has exposure to negative earnings, compared with 5% for large caps. Hence using unadjusted P/Es is likely to result in spikes and outliers especially around times of high market volatility, when earnings deteriorate.
Therefore, for our analysis to make valuations more comparable, we have only considered companies with positive trailing 12-month earnings.
For the S&P 500 the current positive P/E is close to its long-term average, but for the Russell 2000 it is positioned towards the lower end of its range, indicating that it has become more undervalued.
Additionally, while the S&P 500 and the Russell 2000 have traded at similar valuations on average, the positive P/E of the Russell 2000 currently looks relatively cheaper than the S&P 500.
Quality counts
Focusing on the high-level characteristics of indices can sometimes paint a rather abstract picture of the drivers of returns. It can therefore be valuable to remember that these abstractions are simply ways of encapsulating the underlying complexity of real companies operating in the real economy.
Today, companies face a challenging set of circumstances. High inflation is driving up input costs which, even though can be partly passed on to consumers, are likely to result in lower margins. Higher interest rates, meanwhile, make the burden of servicing debts more difficult to shoulder.
As we saw during March 2023, the consequences of tougher economic climates can be amplified in small-cap companies. Compared with large, more-established companies, small caps potentially suffer a greater impact on their profits and their shares can be subject to higher risk and volatility.
In such an environment, we believe adding a quality overlay that considers metrics such as return on assets and leverage to US small-cap exposure, without affecting the original sector allocation, could add resiliency to a portfolio. Such overlay can be helpful to increase exposure to companies that are potentially better placed to weather these difficulties, and reduce exposure to those with poorer quality characteristics.
While the current macro environment remains challenging to navigate, and only time will tell whether good things really can come in small packages, the potential benefits of an approach that rewards diversification and resiliency should not be overlooked.
*For illustrative purposes only. Reference to a particular security is on a historic basis and does not mean that the security is currently held or will be held within an LGIM portfolio. The above information does not constitute a recommendation to buy or sell any security.
**It should be noted that diversification is no guarantee against a loss in a declining market.
[1] As at 28 March 2023
[2] As at 28 March 2023

Recommended content for you
Learn more about our business
We are one of the world's largest asset managers, with capabilities across asset classes to meet our clients' objectives and a longstanding commitment to responsible investing.
