Disclaimer: Views in this blog do not promote, and are not directly connected to any L&G product or service. Views are from a range of L&G investment professionals, may be specific to an author’s particular investment region or desk, and do not necessarily reflect the views of L&G. For investment professionals only.
Private equity structural alpha: Myth or measurable?
Does private equity offer anything, on a risk-adjusted basis, above listed equity?

Elusive beta
There’s broad consensus that, historically, private equity has outperformed public equity even though this comes with important caveats such as data quality concerns, selection bias and measurement issues.
Yet perhaps the more critical question is whether private equity outperforms on a risk-adjusted basis. Could similar outcomes be achieved simply by leveraging public equity?
To explore this, we must estimate private equity’s ‘beta’ - its sensitivity to movements in broad public markets. This helps determine whether it generates returns beyond what market exposure alone would suggest. We refer to this excess return as “structural alpha” [1]. We’ve included the word “structural” here as the term “alpha” is heavily loaded. In public markets it tends to mean zero-sum, manager skill relative to a market cap benchmark, whereas we’re interested in systematic return drivers beyond listed-equity beta.
The NAV illusion
A key challenge is that private market returns based on net asset values (NAVs), may understate true risk, giving betas around 0.3. This is due to the subjective nature of NAV appraisals, delays in reporting, and a tendency for valuations to be anchored to prior quarters.
To assess risk more accurately, two common approaches are often used:
(1) Apply a “de-smoothing” process[2] to raw returns, to strip out artificial persistence[3].
(2) Examine a public market equivalent (PME). This could be an index like the LPX 50, which tracks the 50 largest and most liquid listed global private equity companies.
Both methods increase the measured volatility and correlation with listed equities, highlighting that private equity is riskier than initial appearances.
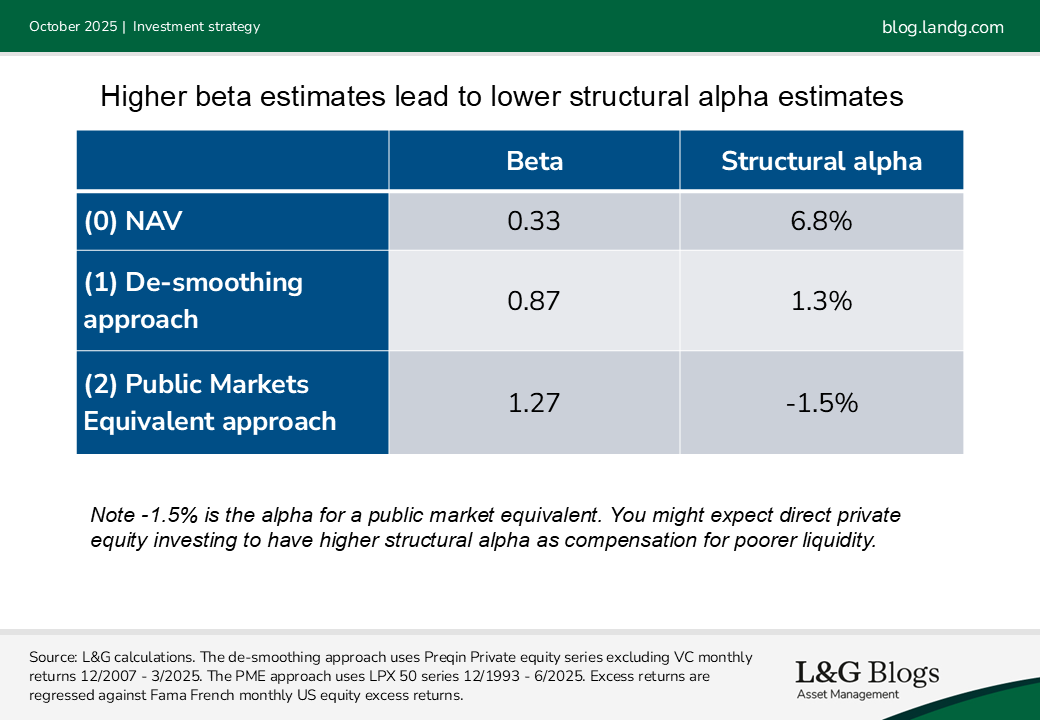
Interestingly, though, betas produced by the first approach are generally much lower than those from the second[4]. This matters because lower beta estimates mean less of the return can be attributed to market exposure and result in higher historic structural alpha estimates, while higher beta estimates lead to a lower - or even negative - structural alpha:
What gives?
One reason for the gap in betas is that investor sentiment (or animal spirits) can dominate short-term changes in public equity prices. This aspect is largely absent from the first method. Appraisers of NAVs tend to update cashflow forecasts (fundamentals) more readily than they update the discount rate (sentiment).
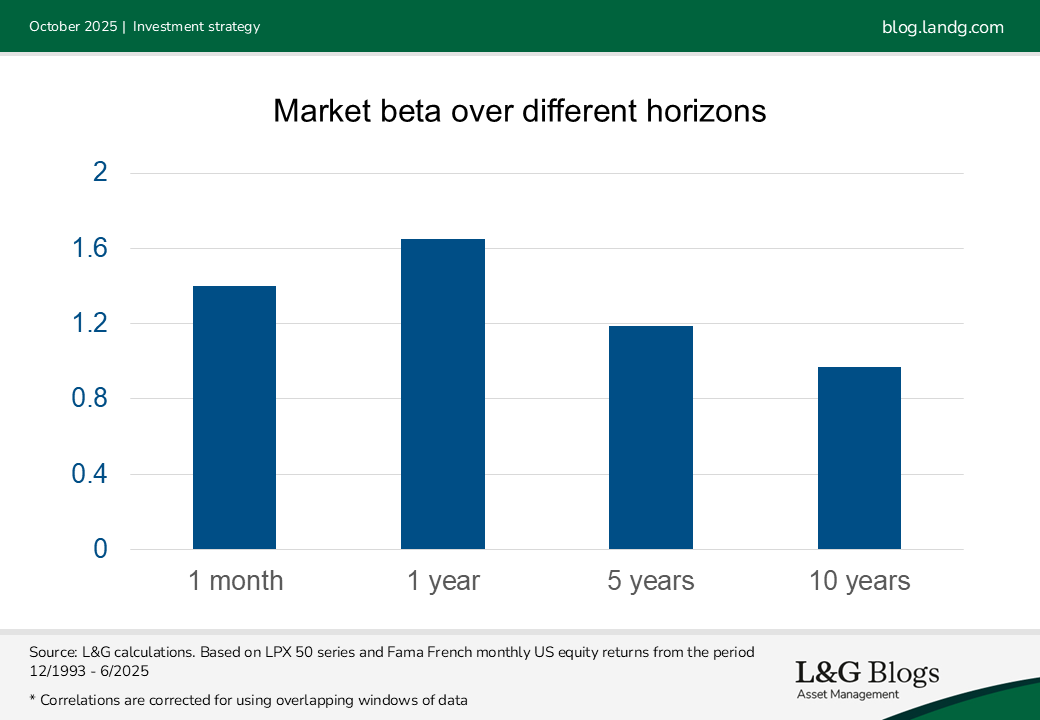
As such, the first method understates short-term risk by ignoring most sentiment-driven volatility. On the other hand, the second method likely overstates long-term risk. This is because fundamentals win out in the long term, with correlations tending to drop over longer horizons, leading to ‘diversification for the long run’. Indeed, we find (modest) support for this in the case of listed private equity vs broad listed equity if we compute betas over increasing horizons:
Where could the difference in fundamentals come from? Well, private companies are often in different situations to public ones. General partner management also has much more influence over private companies. Private fund structures are more than just a wrapper.
As private equity investors are generally long-term holders, recognising a substantially lower beta, and higher structural alpha, than the second method could be appropriate[5].
Consistently inconsistent
Many papers opine on this thorny topic, revealing mixed evidence and a lack of consensus. For example:
· MSCI estimates global private equity has outperformed levered public equity by 3.5% p.a.
· AQR suggests private equity offers scant illiquidity premium once market beta and factor tilts are allowed for.
· The Institute for Private Capital measured historical private equity alphas that are sometimes positive and sometimes negative, with none (statistically) significantly different from zero.
· A study by Norges Bank Investment Management found that, on average, buyouts outperformed public equities by 3-4% p.a. but that venture capital and growth equity underperformed by 1-2% p.a.
A strategic view
When evidence is mixed it’s important to have a good prior. A reasonable one is that investors should expect some structural alpha to reflect:
· An illiquidity premium to compensate for holding assets that are hard to sell, with capital locked up for years
· Exposure to factors such as size and value[6]
· Potentially more favourable governance: less diffuse and more hands-on ownership, better aligned incentives (skin in the game) and freedom from short-termism. Limits to arbitrage may mean this isn’t fully priced-in
Overall, our best estimate is that private equity delivers some modest risk-adjusted outperformance. As a baseline, we assume around 1% p.a. structural alpha net of fees for private equity[7], which includes any potential factor exposures. However, the figure varies depending on the type of private equity, how investors access it, costs and the scope for managers to add value. Importantly, this also only represents a long-term estimate; current valuations should also be considered when setting shorter-term expectations.
[1] It’s important to approach this carefully, as structural alpha can stem from various sources - some potentially replicable in public markets.
[2] De-smoothed returns are calculated as (R_t – cR_{t-1})/(1-c) where c is the autocorrelation of smooth returns. Autocorrelation is estimated by fitting an AR(1) model and adjusting regressed slope for bias.
[3] Otherwise known as autocorrelation
[4] A study by Partners Capital found betas to the S&P 500 from method (1) range from about 0.3 to 0.8, depending on the specific private equity index. Our own calculations, using Preqin data for private equity excluding venture capital, indicate a beta of around 0.9. In contrast, PME-based betas for private equity relative to listed equity are much higher. The same study, and our analysis using the LPX 50 index, finds short-term betas around 1.3.
[5] Especially if you add an illiquidity premium, given LPX 50 is liquid
[6] Even though those elements are replicable publicly so could be excluded from other definitions of alpha
[7] We want to reflect this long-term advantage one way or another, especially as private market investors are long-term investors. When it comes to optimisation / SAA work, modelling a declining beta can be troublesome – a standard approach is to implicitly assume long-term betas equal their short-term values from a PME approach. To compensate for the overstatement of risk in the long run, an addition to expected return might be made.


Recommended content for you
Learn more about our business
We are one of the world's largest asset managers, with capabilities across asset classes to meet our clients' objectives and a longstanding commitment to responsible investing.
