Disclaimer: Views in this blog do not promote, and are not directly connected to any L&G product or service. Views are from a range of L&G investment professionals, may be specific to an author’s particular investment region or desk, and do not necessarily reflect the views of L&G. For investment professionals only.
Factor forecasting, recalibrated
We update some past research into expected returns and risk of factors to allow for recent experience.

Several years ago Aniket Das and John Southall (a coauthor of this blog) published a paper, exploring how much ‘juice’ is left in factors, and how their performance profile may change in the future. The analysis involved a careful study of historic return performance, using data up to 31 December 2016. Time flies and we now have more data to base our analysis on. The question is: does it change the conclusions?
James Giblin has written a great blog that explains what factor-based investing (FBI) is; below we give a brief recap.
What is FBI?
Under the Capital Asset Pricing Model (CAPM), a stock’s expected excess return is driven by the expected excess return of the market and the stock’s beta to the market. However, empirical tests suggest that additional factors may contribute to an asset’s expected returns.
Factors such as size, value, low risk, momentum, and quality have been identified as significant drivers of returns beyond the market factor. FBI invests in a way that increases exposure to them. This approach can improve risk-adjusted returns, offering a more comprehensive way to capture systematic sources of return beyond what CAPM predicts.
There are different ways to define factors, as explained in our paper, but the approach we took is to study ‘beta-neutralised’ returns. This involves shorting an amount of the market cap index such that market returns are hedged out and the pure factor return is all that remains.
This is slightly different from standard academic practice where instead of the short market cap index position, a short portfolio of stocks that are least exposed to a factor is used instead. However, we recognise that most of our clients won’t invest in strategies that short individual stocks and hence we avoided this in our process.
Transient trend or lasting force?
There are reasons to be sceptical of the continued outperformance of these additional factors, including[1]:
- Data mining: This is trawling through historical data to find patterns. This can lead to obtaining many seemingly significant results which may be just due to chance
- Informed trading: as investors become increasingly aware of a rewarded factor, the factor may become less profitable as they exploit it
However, there are also solid reasons to believe factors could persist if they stem from risk-based, behavioural, or structural reasons. Examples include:
- Structural: The low-risk factor may be driven by leverage aversion – investors seeking high returns may bid up high-risk stocks.
- Risk-based: the size factor may be compensation for the illiquidity of small cap stocks. The value factor could be a reward for bearing negatively skewed returns.
- Behavioural: the momentum factor may be due to anchoring and slow belief updating.
A combination of such explanations together with strong empirical evidence, particularly ‘out-of-sample’[2] can help justify a sensible belief in factors. And whilst the conventional wisdom is that markets become inexorably more efficient with time, Cliff Asness of AQR has argued the opposite.
Extending the evidence base
We formed out estimates using the process shown below, which makes allowances for the data issues highlighted:
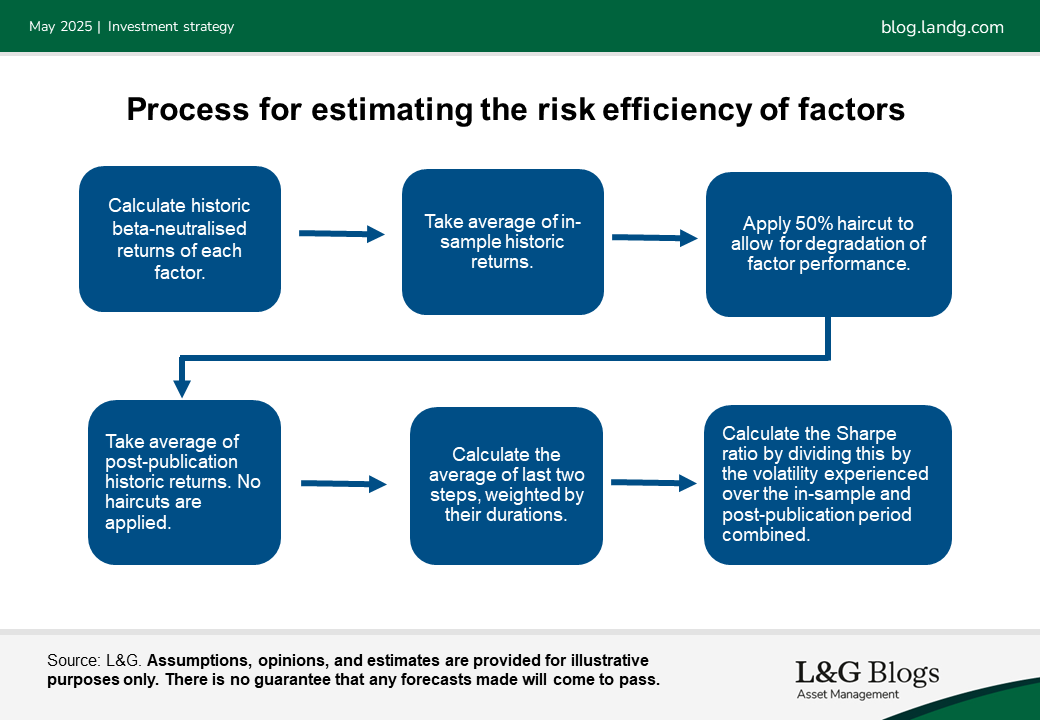
This is based on a deliberately simple approach for the five major equity factors, and primarily uses the Fama French database (and their ways of constructing portfolios).
The chart below contrasts our latest results from this calculation, using data up to 31 December 2024, against our previous estimates:
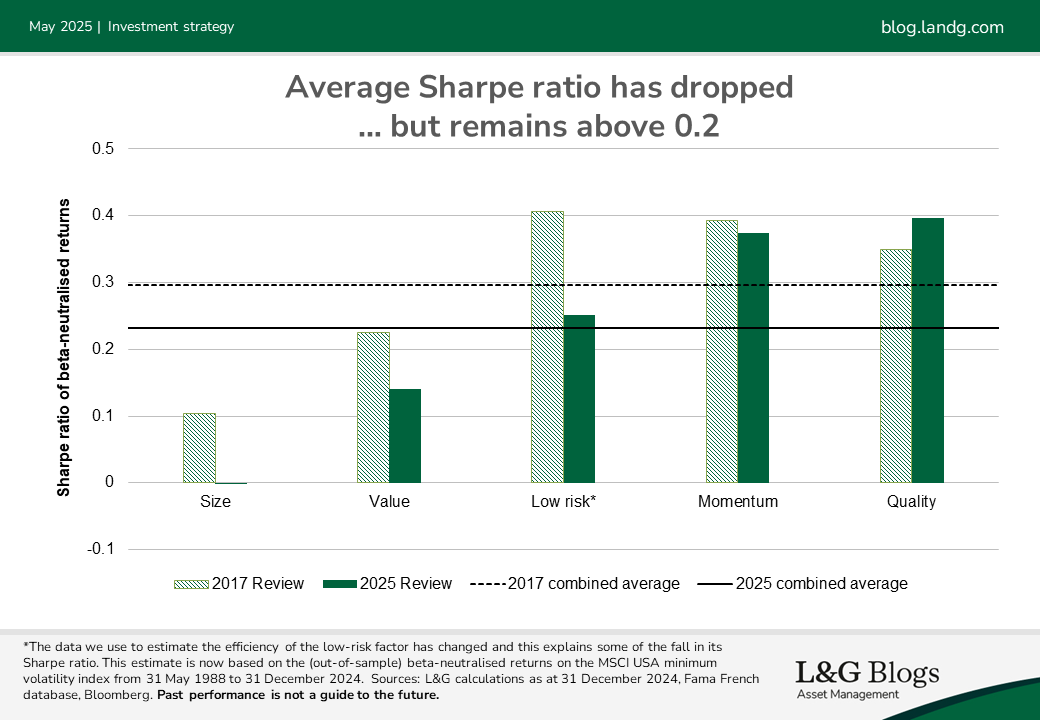
As you can see, other than quality the estimates have taken a hit (although the hit to low-risk can largely be explained by a modification to the data and time period used there[3]).
There are some reasons to believe that risk efficiency of factors could equalise somewhat in the future, because higher Sharpe ratio factors might be bid-up until their relative advantage disappears (which requires less capital than trying to arbitrage away an entire factor itself). The average Sharpe ratio across the 5 factors in the 2017 study is the dotted black line in the chart.
For illustrative purposes, and prudently, we used a lower 0.2 Sharpe ratio for each factor as a round number. Under that assumption, we calculated that a long-only portfolio equally weighted across the five factors might expect to outperform the market index by around 1.0% per annum, before costs and fees, with volatility slightly lower than the market cap index.
The solid black line – representing the refreshed average – is lower than the dotted one but remains above 0.2. If 2025 was the first time we’d ever did the study, it’s quite possible we’d have also chosen 0.2 and got the same final answer. However, if we keep the same degree of prudence as before then we land on a slightly lower figure of around 0.8% per annum.
A wide range of alpha assumptions remain sensible, though, including our original 1.0% figure. This is particularly the case given that how difficult it is to make definitive statements about strategies with low Sharpe ratios. For example, a strategy with a genuine Sharpe ratio of 0.2 has about a one-in-four chance of delivering negative excess returns over any given decade.
Plenty of caveats apply. Our analysis:
- Is based on US equity returns motivated by its detailed and long history. As such, the results, particularly the changes since last time, are impacted by the rise of mega-cap technology in recent years. These companies tend to be positive on the quality factor but negative in terms of low risk and value. As such this may partly explain why the low risk and value factors have taken hits while quality has done well. The story within other regions may well differ, which could matter to more globally diversified investors.
- Reflects just one possible approach and is deliberately simplistic – more sophisticated construction methods may perform better. For example, whilst the size factor appears to struggle in isolation, it can still shine when combined with other factors in a more bottom-up approach. As another example, factor definitions may need to adapt over time. For instance, the Fama French definition of value was designed decades ago, when tangible assets dominated and there were different accounting standards.
- Should only ever be treated as a rough guide. There will always be substantial uncertainty.
That said, we think it lends a useful perspective and shall continue to keep an eye on it!
Past performance is not a guide to the future. Assumptions, opinions, and estimates are provided for illustrative purposes only. There is no guarantee that any forecasts made will come to pass. It should be noted that diversification is no guarantee against a loss in a declining market.
[1] Another is survivorship bias: the factors investors focus upon today may just be the ones lucky enough to continue to perform well out-of-sample.
[2] When a factor is covered by an academic journal, the results and conclusions of the report would be based on data from a specific timeframe. We define this timeframe as being in-sample. Data post publication date is considered out-of-sample.
[3] In our revised approach we have avoided using AQR’s BAB long-short return series as we believe this could lead to an overstatement of the Sharpe ratio possible in a long-only portfolio.


Recommended content for you
Learn more about our business
We are one of the world's largest asset managers, with capabilities across asset classes to meet our clients' objectives and a longstanding commitment to responsible investing.
