Disclaimer: Views in this blog do not promote, and are not directly connected to any L&G product or service. Views are from a range of L&G investment professionals, may be specific to an author’s particular investment region or desk, and do not necessarily reflect the views of L&G. For investment professionals only.
Factor checking the market

A wide range of equity risk factors (or styles) have been identified in academic literature, yet there remain relatively few that are both compensated (i.e. they deliver a positive risk premium over time) and transparent (i.e. there is a plausible and widely accepted rationale for their persistence). Five factors have historically exhibited both characteristics: value, low volatility, quality, size, and momentum.
While individual factors can go through sustained periods of relative under- or outperformance, they are likely to do so at different times. It follows that a balanced portfolio of factor exposures should provide cost-effective exposure to the range of positive risk premia over the long term, while the diversification across factors should reduce volatility when compared with individual factor exposure or factor-timing strategies.
But although correlations among equity risk factors remain low over long periods, this does not necessarily translate to consistent positive performance. There are other risks to consider, including factor degradation, crowding, a rise in correlations between factors, and the outperformance of the largest stocks in the universe.
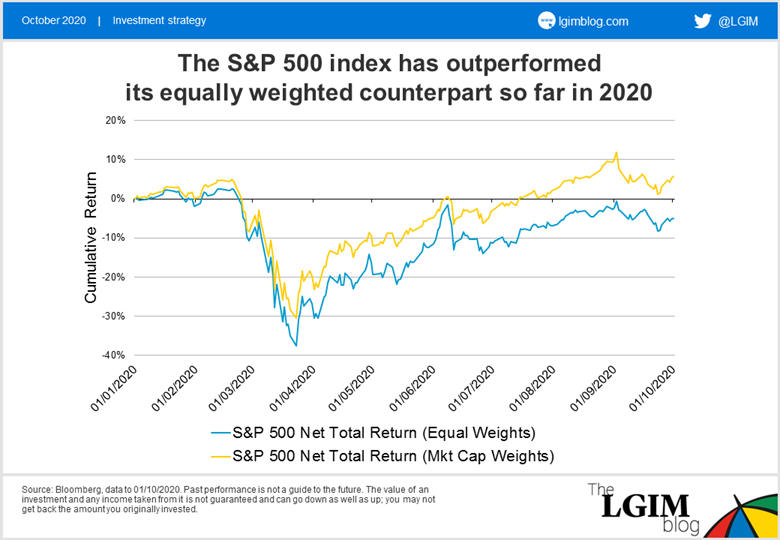
This year has been tough on US equity factor portfolios, largely because of the outsized influence of technology stocks. The outperformance of the largest stocks in the market-cap weighted index has weighed heavily on the returns of any diversified equity strategies that move away from the ‘tallest trees’ in the index.
We can see this effect simply by looking at the performance of an equally weighted version of the S&P 500 index, which has underperformed its market-cap weighted equivalent by 10% over the year to the end of September. Part of that underperformance reversed in September as some of the froth in tech has been removed, but it is undoubtedly too early to call a sustained rotation in the US.
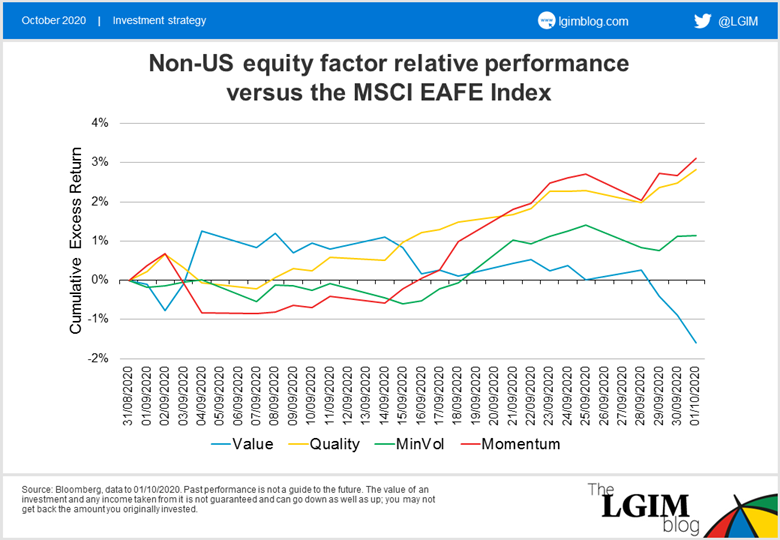
The same cannot be said of factor portfolios outside the US, however, where there is much less of a tech bias. The recent bout of risk aversion has seen non-US factors behave more in line with expectations, with quality, momentum and low volatility stocks outperforming, while value has underperformed. Where we have allocated to a basket of non-US factors, their positive contribution has been an effective diversifier over the past month.
Appendix: performance of indices cited
| S&P 500 Net Total Return (Equal Weights) | S&P 500 Net Total Return (Mkt Cap Weights) | MSCI EAFE Value vs MSCI EAFE, Net Total Return | MSCI EAFE Quality vs MSCI EAFE, Net Total Return | MSCI EAFE Minimum Volatility vs MSCI EAFE, Net Total Return | MSCI EAFE Momentum vs MSCI EAFE, Net Total Return | |
|---|---|---|---|---|---|---|
| 2015 | -2.78% | 0.75% | 8.83% | |||
| 2016 | 14.11% | 11.23% | -4.06% | -2.78% | ||
| 2017 | 18.23% | 21.10% | -1.74% | 0.49% | -2.73% | 2.80% |
| 2018 | -8.18% | -4.94% | -2.60% | 3.90% | 9.39% | 0.76% |
| 2019 | 28.43% | 30.70% | -6.42% | 7.46% | -4.32% | 1.54% |

Recommended content for you
Learn more about our business
We are one of the world's largest asset managers, with capabilities across asset classes to meet our clients' objectives and a longstanding commitment to responsible investing.
