Disclaimer: Views in this blog do not promote, and are not directly connected to any L&G product or service. Views are from a range of L&G investment professionals, may be specific to an author’s particular investment region or desk, and do not necessarily reflect the views of L&G. For investment professionals only.
Could valuation metrics appear more valuable than they actually are?
Hindsight bias is a hazard when seeking to estimate future returns. But in a technical dive into modelling estimates of future equity returns, I explain another problem: how a statistical illusion can mislead investors.

Beware the Texas sharpshooter
One problem with using valuation metrics as a means of estimating future returns is that what looks ‘expensive’ or ‘cheap’ can change over time. For example, back in 1995 the cyclically adjusted price-to-earnings ratio (CAPE) for US equities was about 20. At the time that looked expensive relative to history so might have been used to forecast low returns. But fast forward to today and such a CAPE value looks distinctly average.
As such there is a danger of hindsight bias, or ‘predicting the past’, much like the Texas sharpshooter who paints the bullseye after taking his shots.
One potential way around this is to assume a simple structural model such as ‘the earnings yield is the real yield’. This sets the nominal expected return to be equal to inflation plus the earnings yield (which is 1/CAPE). The idea is that if earnings grow in line with inflation this ought to be the return you could achieve in the long run. Assuming the model wasn’t chosen or fitted with the benefit of hindsight, it means that all of history can be considered ‘out of sample’.
The below plots historical real returns over 10-year periods against the earnings yield at the start of the period. This uses monthly data from Robert Shiller’s website, which stretches back to 1881:
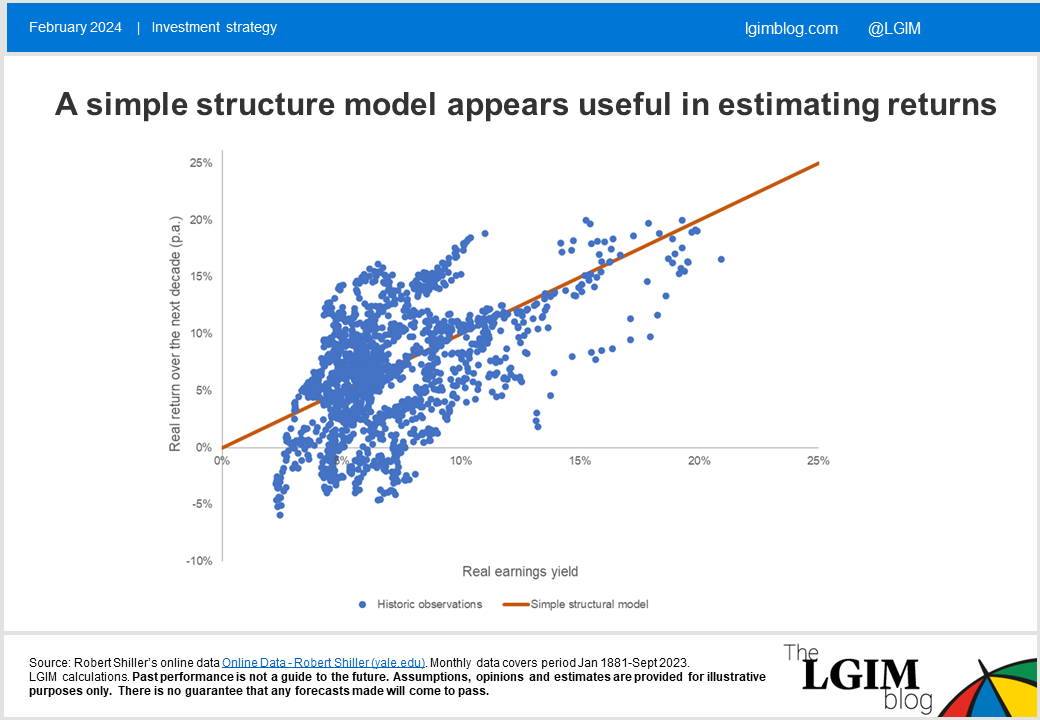
The simple structural model, represented by the orange line, appears to show a positive correlation. It’s not quite the line of best fit, but still looks very respectable. So, the earnings yield could be used to help estimate future returns, right?
Not so fast
While earnings yields do have the potential to help us in our estimations, a statistical illusion means we can’t reach that conclusion so easily.
To demonstrate, I ran some simulations[1] over a 100-year period. I made the following assumptions:
- Earnings and prices are random walks[2], both with expected real increases of 5% p.a.
- Prices have a volatility of 20% p.a. whereas (cyclically adjusted) earnings have a volatility of 4% p.a.
- Increases in earnings and prices are 50% correlated over 10-year horizons.
- The initial earnings yield is 5%.
These parameters might not be perfectly realistic, but the key feature for this experiment is designed such that the earnings yield has no ability to help estimate future returns. Yet below are some typical scatter plots that result from the simulations:
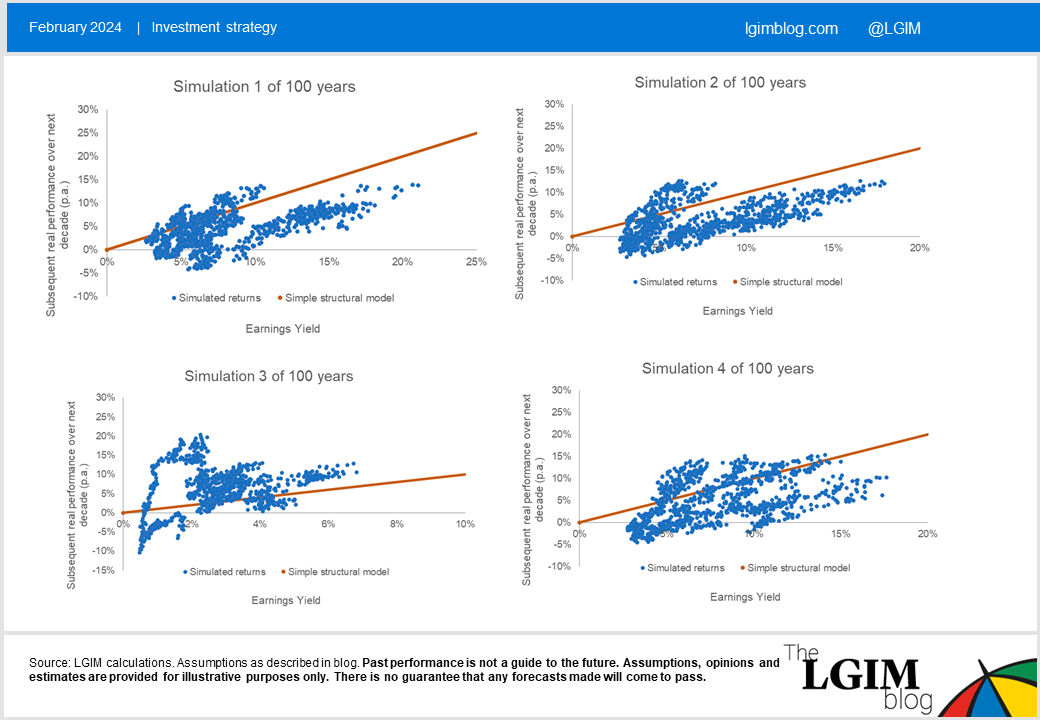
The simple structural model (represented in orange) appears to fare well. Indeed, in over 60% of simulations, it seems to help explain returns better[3] than a theoretical ‘best estimator’ for this model! The ‘best estimator’ we use in this illustration is constant 5% real return, as return estimates were constructed to be completely random around this average level.
What’s going on?
At first sight, this may be baffling. How can the return estimates we’ve constructed to be unpredictable from the earnings yield, appear to show positive correlations between the two?
The answer relates to finite samples – here we have only used 100 years of data. If you inspect those blue dots to the right of the charts, their high earnings yields are likely to have been caused by prior below-average investment returns. But, as there is only a finite pool of potential returns relative to the average, this can leave behind higher-than-average returns for the future. And it's these that get plotted on the vertical axis.
The smaller the sample size, the more of a problem this is and the more likely we are to falsely conclude that the structural model works as a means of estimating future returns. The below shows how the chance of being fooled is high over shorter horizons (such as 50 years) and remains substantial even with hundreds of years of data:
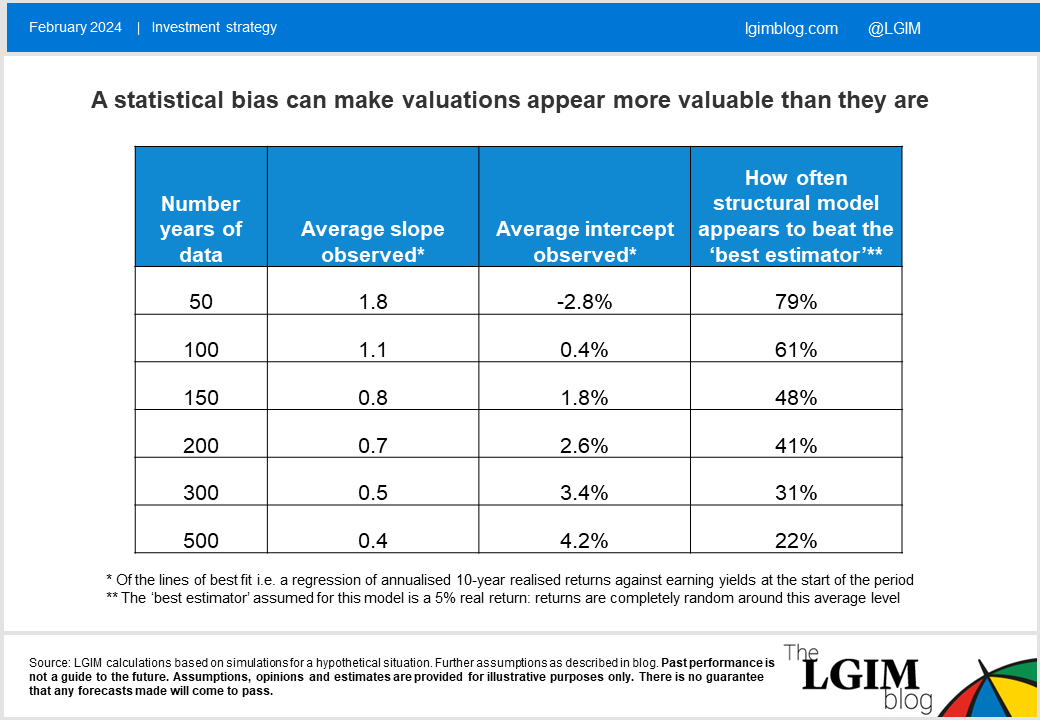
Similar statistical illusions arise whenever you try to estimate future returns with anything that depends on past returns. Other examples include dividend yields, or the average investor equity allocation. In its purest form, strong/weak past returns can appear useful in helping to estimate the likelihood of weak/strong future returns, even if this is not the case. The illusion is easily missed since it ties in all too neatly with the intuition that what goes up must come down.
Don’t bin valuations
I’m keen to stress that this does not necessarily make valuation metrics, such as CAPE, a poor way of setting expected returns. We should never expect any method (valuation-based, risk-based, historic average, or other) to be an accurate tool for estimating equity returns, simply because equities are so volatile. If any method were fantastically accurate, equities wouldn’t be so risky!
In a blog last year, we saw how ‘cash-plus’ models for nominal equity returns do not fare well empirically – rather they make sense theoretically and it’s difficult to disprove them given limited history and high return volatility.
All that’s required, and the best that could ever be hoped for, from valuation metrics is that they help us make slightly less worse estimates. The above shows it is challenging to confidently conclude they genuinely help, but that doesn’t make it impossible. Indeed, there is academic evidence, such as this paper, that supports the idea that valuations can give you an edge.
Watch this space for how much of an edge it might give, and what the potential implications could be for asset allocation.
[1] Alex White at Redington has performed similar simulation experiments on CAPE
[2] Geometric Brownian Motions
[3] In this case ‘better’ means ‘A smaller sum of squares difference error’

Recommended content for you
Learn more about our business
We are one of the world's largest asset managers, with capabilities across asset classes to meet our clients' objectives and a longstanding commitment to responsible investing.
