Disclaimer: Views in this blog do not promote, and are not directly connected to any L&G product or service. Views are from a range of L&G investment professionals, may be specific to an author’s particular investment region or desk, and do not necessarily reflect the views of L&G. For investment professionals only.
LGIM’s ESG score methodology just turned five. What have we learnt so far?
Ahead of a major publication in September showing longer-term regional, sector and ESG pillar trends, here’s a sneak preview of the overall direction of travel.

This week LGIM’s ESG score – our proprietary, rules-based approach to scoring companies from an environmental, social, governance (ESG) and transparency perspective – hits the five-year milestone. Our ESG score helps determine the weighting used in the Solactive L&G ESG Index Family.
The methodology of LGIM’s ESG scores starts with an assessment of market-wide ESG issues that could potentially affect long-term returns and which we believe could represent a risk if not addressed, such as climate change or the dilution of shareholder rights. This focus on overall market health, anchored with minimum standards, differentiates LGIM’s ESG score from many others applied in market indices.
In September we will publish a significant piece of research exploring how companies are faring across the three components of ESG, as well as the crucial fourth pillar of transparency.
In addition to exploring the evolution of scores over the five years since our score was launched, the study will draw on long-term data to show changes over 14 years – providing valuable insights in a field that is often characterised by a paucity of information.
Ahead of this data release, here’s a high-level snapshot of how the ESG scores of a global benchmark of developed and emerging market equities1 have changed in the five years since we launched our scores:
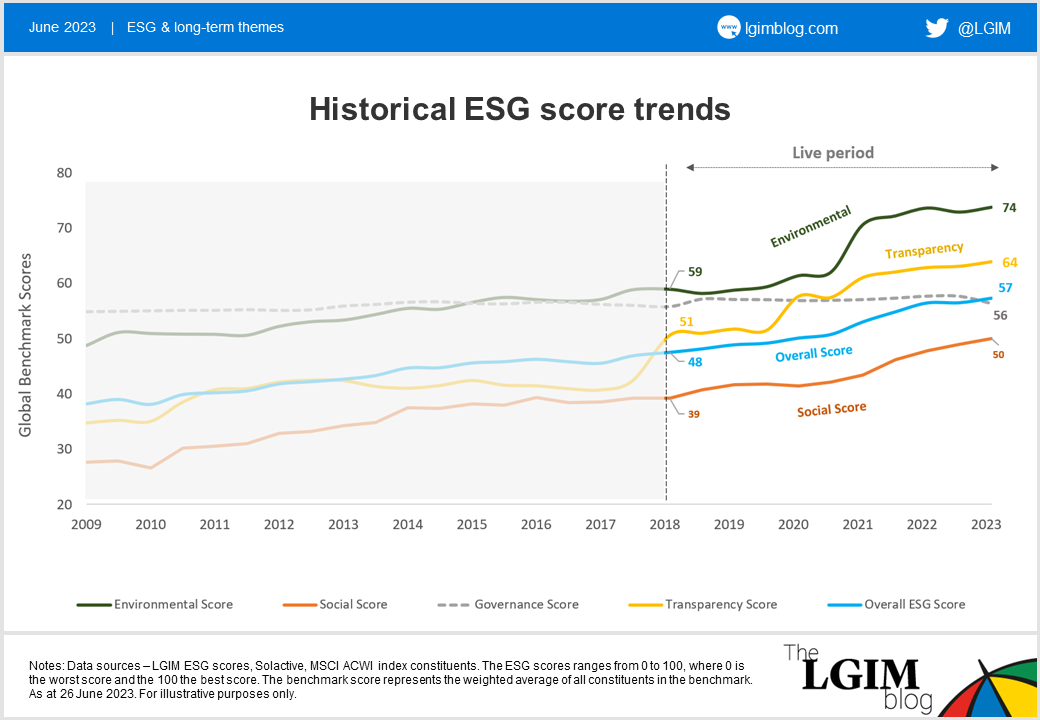
Overall, we’ve seen a clear trend of improvement over the past half-decade in our benchmark based on the MSCI ACWI and Solactive GBS market cap equity universe. Examining the pillars in turn:
- The environmental score showed an increase of 25%, starting at 59 and peaking at 74 in March 2023
- The social score exhibited a significant improvement of 28%, starting at 39 and reaching a peak of 50 in the same period
- The governance score remained relatively unchanged at 56 in the past five years up to March 2023
- The transparency score demonstrated a remarkable improvement of 25%, starting at 51 and reaching a peak of 64 in March 2023
- Lastly, the overall ESG score (including transparency) displayed substantial increase of 19%, starting at 48 and reaching a peak of 57 in March 2023
While the overall trend is encouraging, this snapshot of changes over the past five years highlights that progress is uneven, with strong improvement of environmental scores but relatively unchanged governance standards in the benchmarks.
It’s also important to note that there are many drivers to the changes we’ve seen – something we will explore in detail in the forthcoming report, along with a comprehensive explanation of the methodology used.
September’s report will highlight many other surprising inconsistencies in ESG progress, providing a differentiated long-term perspective on this crucial subject.
1. The index is based on MSCI ACWI and Solactive GBS market cap equity universe.

Recommended content for you
Learn more about our business
We are one of the world's largest asset managers, with capabilities across asset classes to meet our clients' objectives and a longstanding commitment to responsible investing.
