Disclaimer: Views in this blog do not promote, and are not directly connected to any L&G product or service. Views are from a range of L&G investment professionals, may be specific to an author’s particular investment region or desk, and do not necessarily reflect the views of L&G. For investment professionals only.
Estimating carbon data: A comparative analysis
What is the most accurate way to estimate missing carbon data and how do we know?

The challenge with missing carbon data
As companies seek to reduce their greenhouse gas emissions, measuring their progress with robust data is crucial. In order to do this, companies must identify where the emissions come from.
Scope 1 emissions are ‘direct’ emissions that are owned or controlled by a company, whereas scope 2 are ‘indirect’ and are associated with the energy the company purchases and uses is produced.[1]
We believe capturing accurate scope 1 and 2 carbon data is crucial for making responsible investment decisions and managing climate-related risk associated with these investments. However, this data is not always available or may be estimated by third-party ESG data providers, making it harder to produce accurate insights.
Our clients are increasingly asking us to improve the accuracy and coverage of our carbon data, so we can continue to hold companies to account on their decarbonisation targets in our aim to better manage the associated risks in our portfolios.
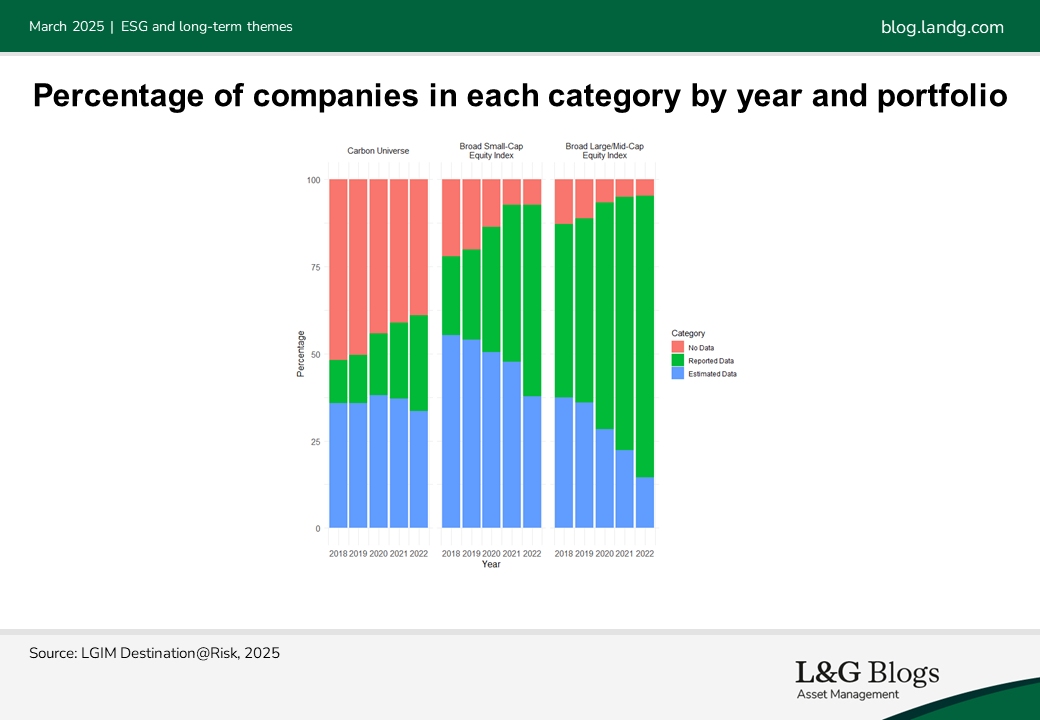
While the number of companies with estimated carbon emissions is decreasing, the impact this has can vary greatly depending on the portfolio. For example, portfolios consisting of more large- and mid-cap companies from developed countries have a much higher coverage of carbon data compared to those with mostly small-cap companies or companies from developing countries.
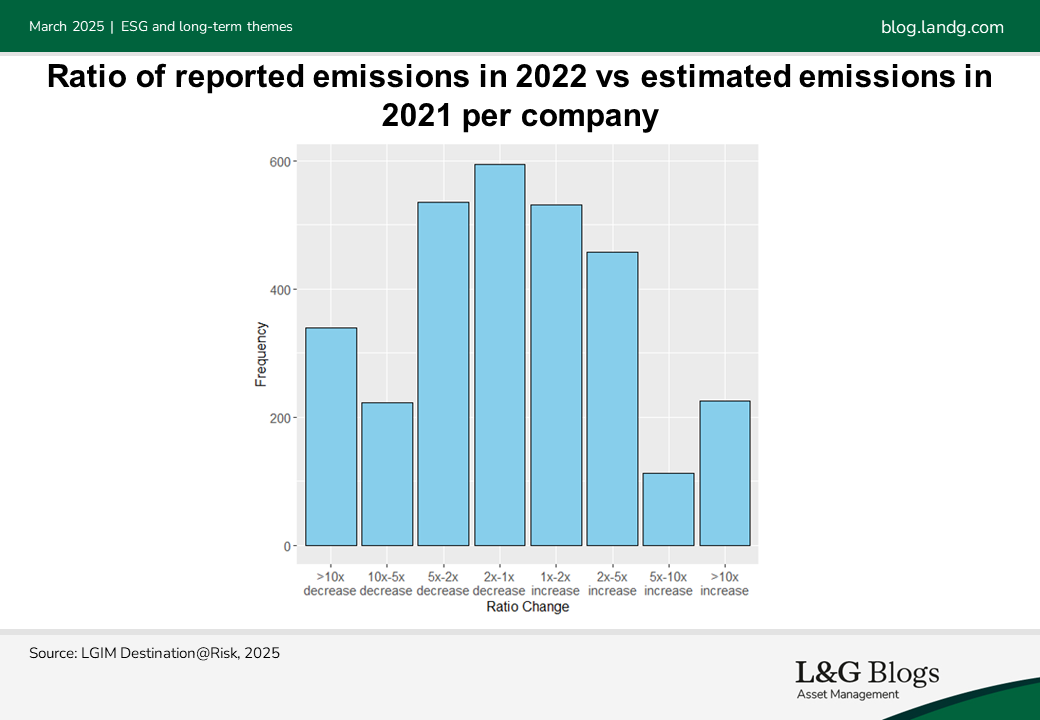
However, when companies start reporting their carbon emissions, the figure can be significantly different from the original estimated figure which may previously have been used in our modelling. For instance, in 2021, 18% of companies with estimated emissions saw their total carbon emissions change by more than ten times when they reported actual emissions in 2022.[2]
Estimating data with carbon proxies
One common solution is to use known carbon data to create proxies that estimate the missing data. However, this introduces a fundamental problem: how do we know our estimates are any good if we do not know what the real emissions are? Our approach to answering this question is to test different proxy methods on the known carbon data rather than the missing carbon data, so we can compare the accuracy of each proxy against this known data.
We use a ‘Monte Carlo’ simulation to randomly select a sample from the known data. With the remaining data points, we produce the estimates and compare them to the data points we removed to calculate the error. By repeating this many times, we can look at statistics like the mean of the estimations and the average error. Then by comparing these values, we believe we can make better judgements about the proxies’ relative accuracy.
The proxy methods tested
There are multiple considerations when creating a portfolio-level carbon data proxy. For example, there can be underlying factors that mean a company is more likely to be missing carbon data. Therefore, using the known carbon data to produce a proxy can be misleading. Another consideration is the reliability of the estimated data. Accurately estimating the missing data can be undermined by inaccurate estimates from our data providers.
Ideally, we would like to estimate the carbon data at a company level, however this requires more comprehensive and reliable data to capture the individual complexities of each company. Instead, for this analysis, we have focused on three approaches for calculating carbon proxies at the portfolio level:
1. Portfolio Mean: Using the mean of known carbon data within the portfolio to estimate missing data.
2. Portfolio Sector Mean: Using the mean of known carbon data within each sector of the portfolio to create sector-specific proxies.
3. Universe Sector Mean: Similar to Portfolio Sector Mean, except using the entire universe of known carbon data to create sector-specific proxies for all portfolios.
Analysing the results
What have we found?
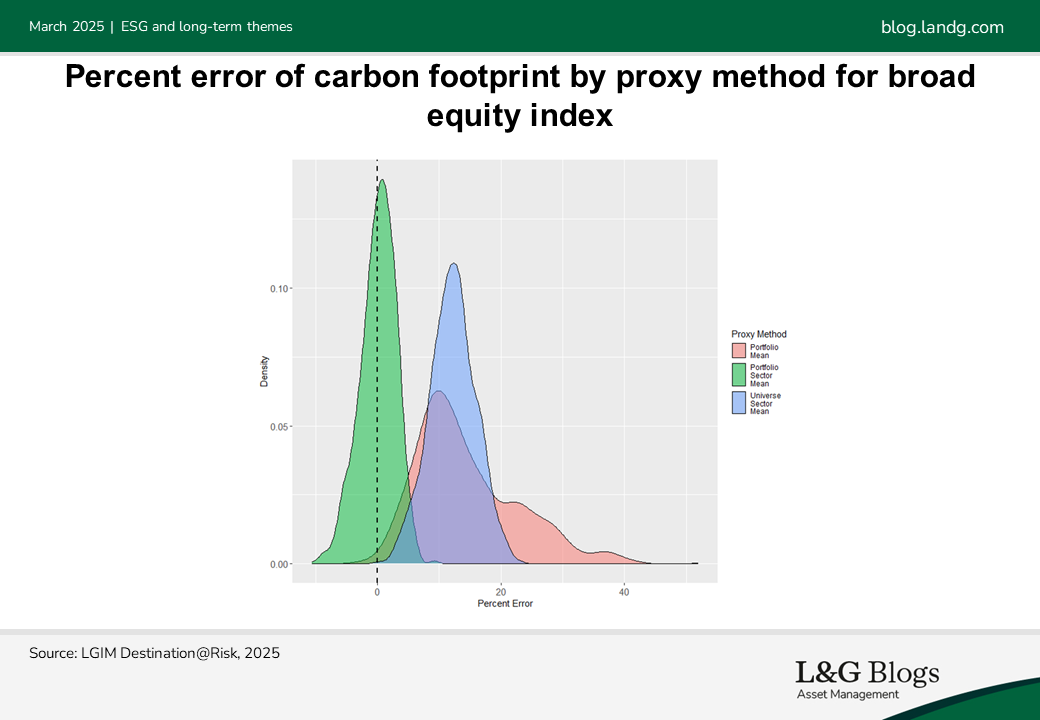
Our analysis shows that the Portfolio Sector Mean method is consistently the most accurate across various portfolio sizes and compositions. Generally, the larger the portfolio, the more accurate this method will be compared to the tested alternatives.
However, it has three key issues that make it vulnerable to greenwashing risks:
1. Portfolio-Specific Proxy: The proxy is based on carbon data already in the portfolio, which can be artificially reduced by selecting securities with lower carbon footprints. Using a proxy based on the entire universe of carbon data can mitigate this issue.
2. Underestimates: This method is more likely to underestimate the portfolio’s carbon footprint. We prefer a method that overestimates in order to be more conservative. On the other hand, the Portfolio Mean method tends to overestimate more often.
3. Fewer Data Points: Using different proxies for each sector means fewer data points are used in the calculations. This makes the proxy more sensitive to changes in individual data points that would arise naturally when companies come in and out of the portfolio.
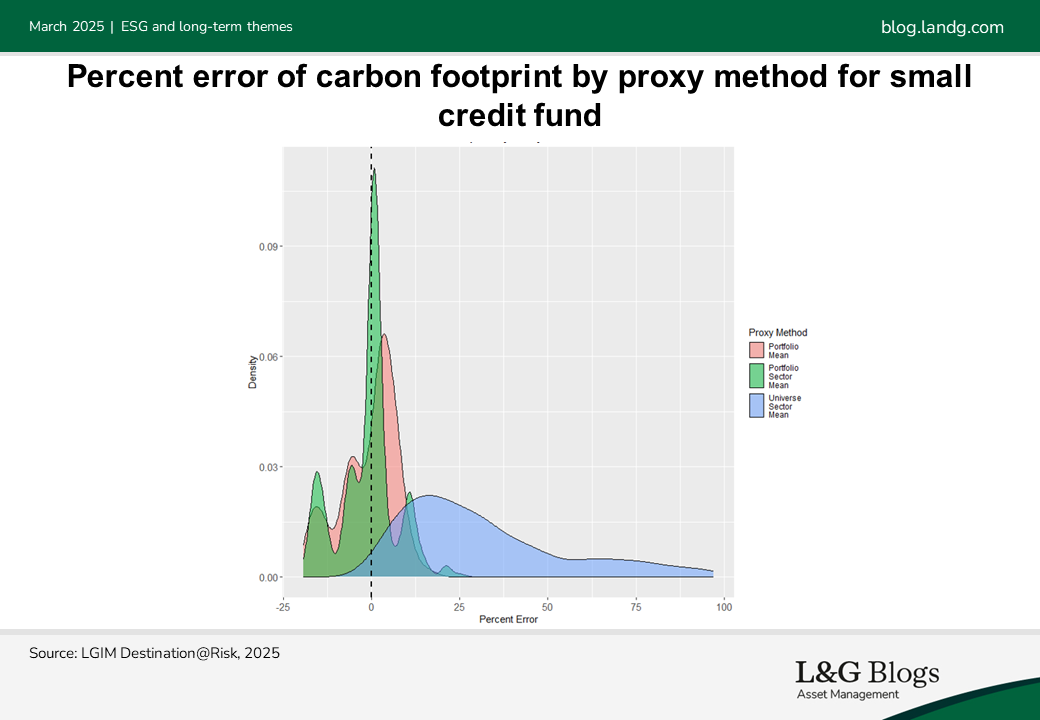
Unsurprisingly, the larger the portfolio the smaller the average error. Small portfolios have much larger error margins due to the element of randomness when selecting which data points to use when creating the proxy. Picking a just a few different data points in a small portfolio can drastically change the proxy values.
The Portfolio Mean provides a reasonable alternative, being less susceptible to greenwashing as it uses more data points in its calculation. However, its key drawback is that it is portfolio specific. The accuracy of the Universe Sector Mean tends to vary the most depending on the portfolio.
Interestingly, the superiority of the Portfolio Sector Mean suggests that sector is an important indicator of the carbon footprint within a portfolio. However, there is likely selection bias since larger companies are more likely to report emissions.
It is also important to note that simulations, especially for smaller portfolios, have a high degree of uncertainty. Monte Carlo simulations depend on the quality of input data, and including estimated data may bias results as these estimates could rely on sector proxies.

Recommended content for you
Learn more about our business
We are one of the world's largest asset managers, with capabilities across asset classes to meet our clients' objectives and a longstanding commitment to responsible investing.
