Disclaimer: Views in this blog do not promote, and are not directly connected to any L&G product or service. Views are from a range of L&G investment professionals, may be specific to an author’s particular investment region or desk, and do not necessarily reflect the views of L&G. For investment professionals only.
Adding a new lens to our CAMERA: mean-reverting valuations and expected returns
We’ve evolved our expected returns framework to incorporate valuation mean reversion, providing new insights into a range of asset classes.

The following is an extract from our Q4 2025 Asset Allocation outlook.
We’re introducing a new enhancement to CAMERA (our expected returns framework): the ability to incorporate historical sensitivities[1] into our valuation signal. The new approach introduces a statistically robust way to incorporate valuation mean reversion, guided by history.
What’s different?
The existing model assumes ratios like the earnings yield (or price to earnings) do not revert to any historical average or equilibrium value. That is a prudent but cautious approach. When equity market valuations are very high (low) we will forecast lower (higher) returns because you have paid more for the future earnings that determine your returns. But we don’t expect any additional losses (gains) from valuations changing. The new model allows for valuation changes.
Why didn’t we do that from the start?
When it comes to forecasting returns, valuation signals are a powerful tool, but they’re not without their problems. We’ve written extensively about the pitfalls of traditional scatterplot or regression-based analysis of valuations and returns: start the 5-part series here. For the purposes of this article, it’s sufficient to note that a lot of charts and regressions you see are overestimating the influence of valuations, and we wanted to avoid making that mistake.
But our new approach corrects for the statistical issues that commonly plague this type of analysis. After correcting for the bias, we find there is still a meaningful impact of valuations on returns. And that in many asset classes the beta is greater than 1. A beta greater than 1 means valuations did historically revert. For those who want to know all the detail, part two of our series goes into more detail on the bias and our correction.
We think having both versions is a great enhancement.
Implications for expected returns
Valuations now play a more prominent role in shaping expected returns. Our existing model already uses valuation signals to inform expected returns. What’s new is that we now allow you to incorporate mean reversion by asset class, based on historical data. This means:
- If valuation has historically been a strong predictor of returns in an asset, the model will reflect that
- If the relationship has been weak or inconsistent, the model will downplay the signal accordingly
- If there’s evidence of mean reversion – where valuations tend to return to long-term averages – we’ll capture that too, even though our core model doesn’t assume it explicitly
Examples: credit vs. equity
To bring it to life, we have two examples. The first is US investment grade credit. The
historical evidence for mean reversion is particularly strong in investment grade spreads, so the impact here is large. The new methodology reduces the risk premium by an additional 0.5%: more than the entire adjustment applied under our previous approach.
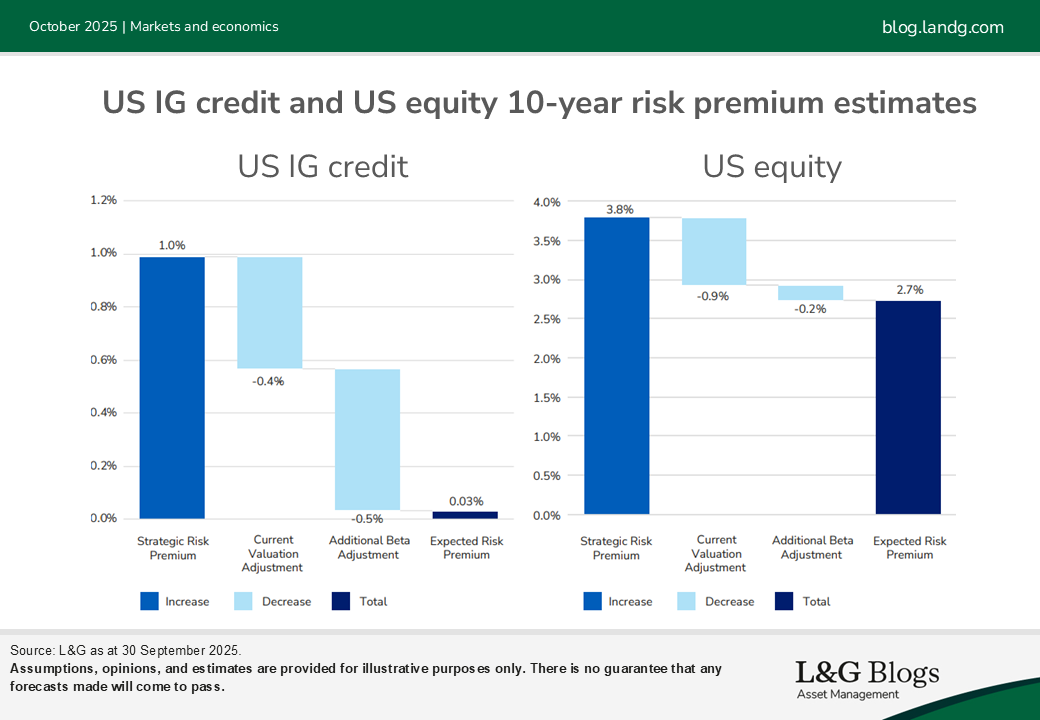
The second is US equity. There is evidence of mean reversion for equity valuations, but it is comparatively weak. So, the effect is smaller. Starting with our structural risk premium of 3.8%, we adjust it for valuations using our current methodology, reducing it by 0.7%. The second adjustment reflects the influence of our new methodology, over and above the current methodology. That is an additional decrease of 0.2%.
What’s next?
CAMERA is an important part of our valuation toolkit. It is one of a variety of valuation signals our strategists use. This enhancement means better valuation signals, particularly in asset classes where historical mean reversion is strong. Being able to estimate both versions of our model should allow us to make more informed decisions and push us to think carefully about which state of the world seems more likely going forward.
That is not the end of our CAMERA innovations. We will continue to develop our model. Expected returns estimates are highly uncertain. Assumptions we make about the world can determine the answer and there are not always obvious right assumptions. To that end, we will continue to stress test alternative assumptions, refine the model and evolve the way we use it.
Read our Q4 2025 Asset Allocation outlook.
[1] This refers to the sensitivity of annualised expected returns over the forecast horizon to the starting yield level. If this number is 0.8, for example, then annualised expected returns change by 0.8% (on average) for every 1.0% change in yield.


Recommended content for you
Learn more about our business
We are one of the world's largest asset managers, with capabilities across asset classes to meet our clients' objectives and a longstanding commitment to responsible investing.
